Other highly desired feature is Copy/Paste in the centre pane.
Given charts exist, it would simplify life for me (less application switching) if we had two related improvements:
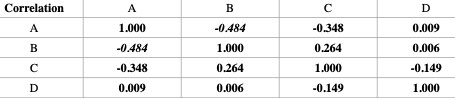
in the correlation table, an indicator of significance at a preset level
linear regression line in the chart
While either of enhanced javascript or (better for me) running external programs seem attractive, they seem also to be off the main game of EDT. Parallelism is nice but I am yet to find EDT slow in my use cases.
Content hiding for simplicity might be a good idea. I don’t know about compactness though. But if you ‘collapse’ the box into a smaller one, you can’t really place other items next to it, or they will be obscured when you expand it again.
Only if we implemented copy/paste as well.
Do you mean in the output produced by the Correlate transform?
That is on the wishlist.
I’m sure if we add linear regression, people will also ask for exponential, polynomial etc. ;0)
We try to be as comprehensive as possible in the transforms, but we will never be able to cover 100% of cases.
I’m sure there are people who would like Easy Data Transform to be faster.
Straightforwardly, create a highlight for numbers which meet a preset level of significance (default p < 0.05). The figures in the correlation table are already in bold so I chose italic. An alternative would be colours coded for p-levels 0.1, 0.05 and 0.001 rather than adding a preference to set the level. This adds nothing to use of screen real estate. The self-correlations are not italicised for obvious reasons.
By the way, the italicised figures of -0.484 are not in fact significant; I was just grabbing some handy data, and the scatterplot shows that even that modest relationship is skewed by two outliers, otherwise random.
I thought this was multiple choice , so the first/only item I selected was not, to me, the most valuable option. I would most appreciate the ability to invoke external programs or scripts, also the human readable audit report would be very helpful.
I checked, and none of the items were shown selected (though my vote was in the result). Rather than click again on the one I did before and run the risk of stuffing the votes I tried clicking on the external program integration and it shifted my vote to that option in the tally. Thx!
Converting PDFs to data tables is a really difficult problem. We would need to find a library that can do that and can be integrated into Easy Data Transform. We have looked, but not found anything suitable, so far.
We have looked at Tabula previously. However it is written in Java and Easy Data Transform is written in C++, so that is problematic. In theory we could probably call Tabula as a separate process, but that isn’t a great solution.