It would be helpful if we could export this result directly.
(only the rows with differences and only the columns with their different values).
Yes, we can do all the comparison in a flow with “subtract” left from right and vice versa, but an easy-to-use compare-data-component that does this for us or an export function within this compare-data-screen would be great
We have thought about doing a Diff transform. I’m not sure how you would best represent the results as a single table though. Especially when the inputs might have different numbers of rows and different columns.
Note that you can Join 2 dataset by key or row number and then use Filter to remove rows where 2 values match in particular columns. This doesn’t really scale when you want to compare lots of columns though. Although I guess you could Concat Cols the columns you care about.
Perhaps you could give some information about a real world example where you need to do this?
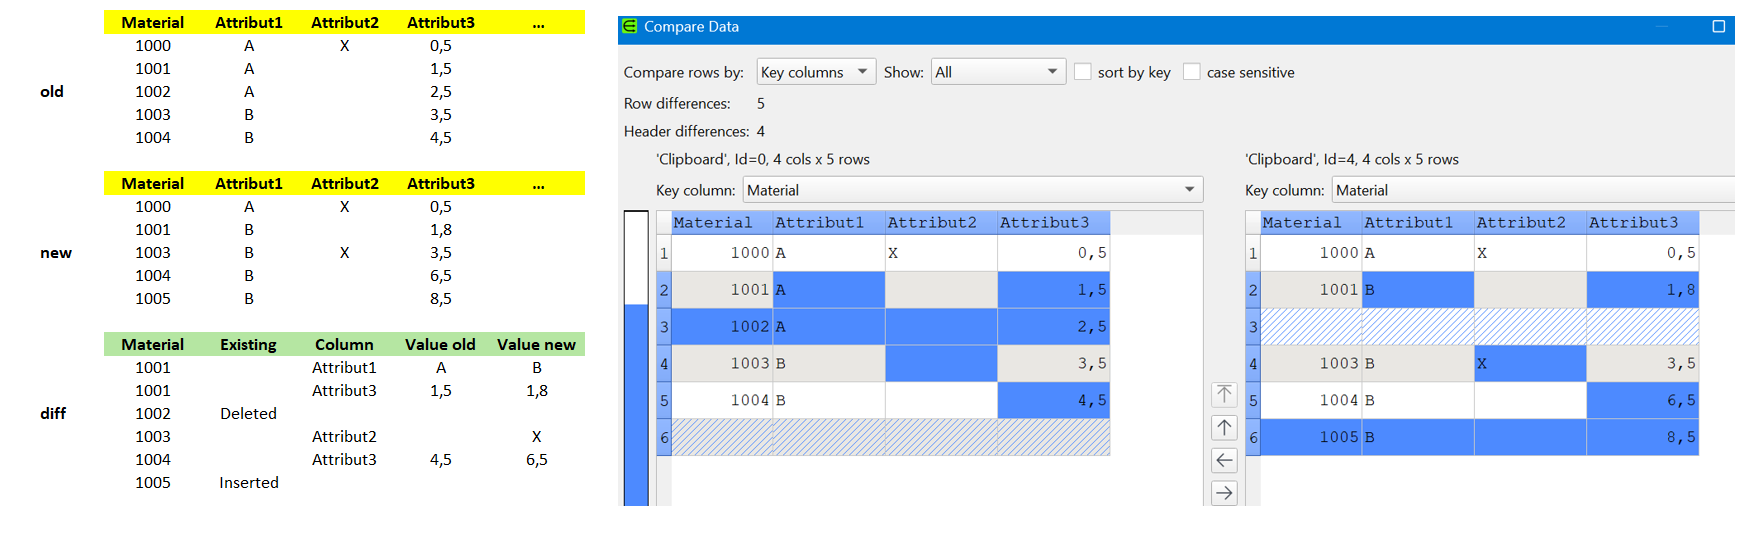
We have a big Material-Masterdata-list with lots of attributes (50+).
When I compare it today with the previous month’s list (based on the material no. as key), I merge all columns and export them if there are differences in any of the columns.
( the number and names of the columns stays the same ! )
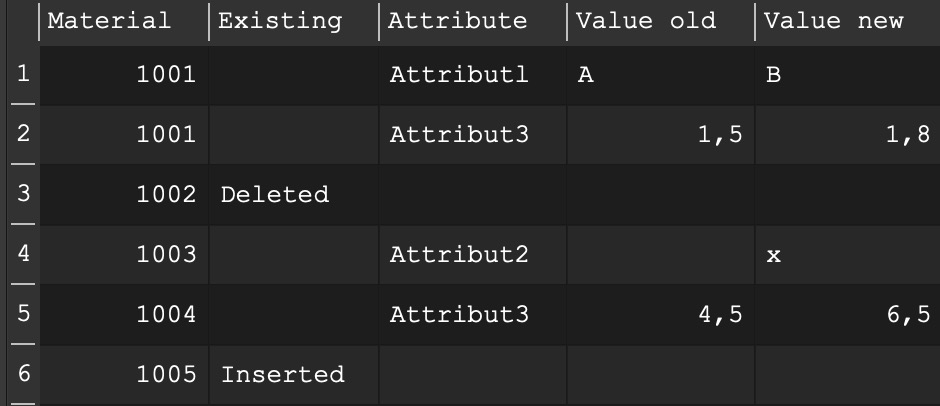
In my wishful thinking, the perfect differences-list will only contain the attribute-name and the old and new values per material-no.
Your ‘diff’ example might be a good way of putting the differences into 1 table and not replying on fonts/colors etc.
Possibly we could add:
A new transform called Diff that takes 2 inputs. The top input is ‘old’ and the bottom input is ‘new’ (or possibly we could refer to them as ‘top’ and ‘bottom’).
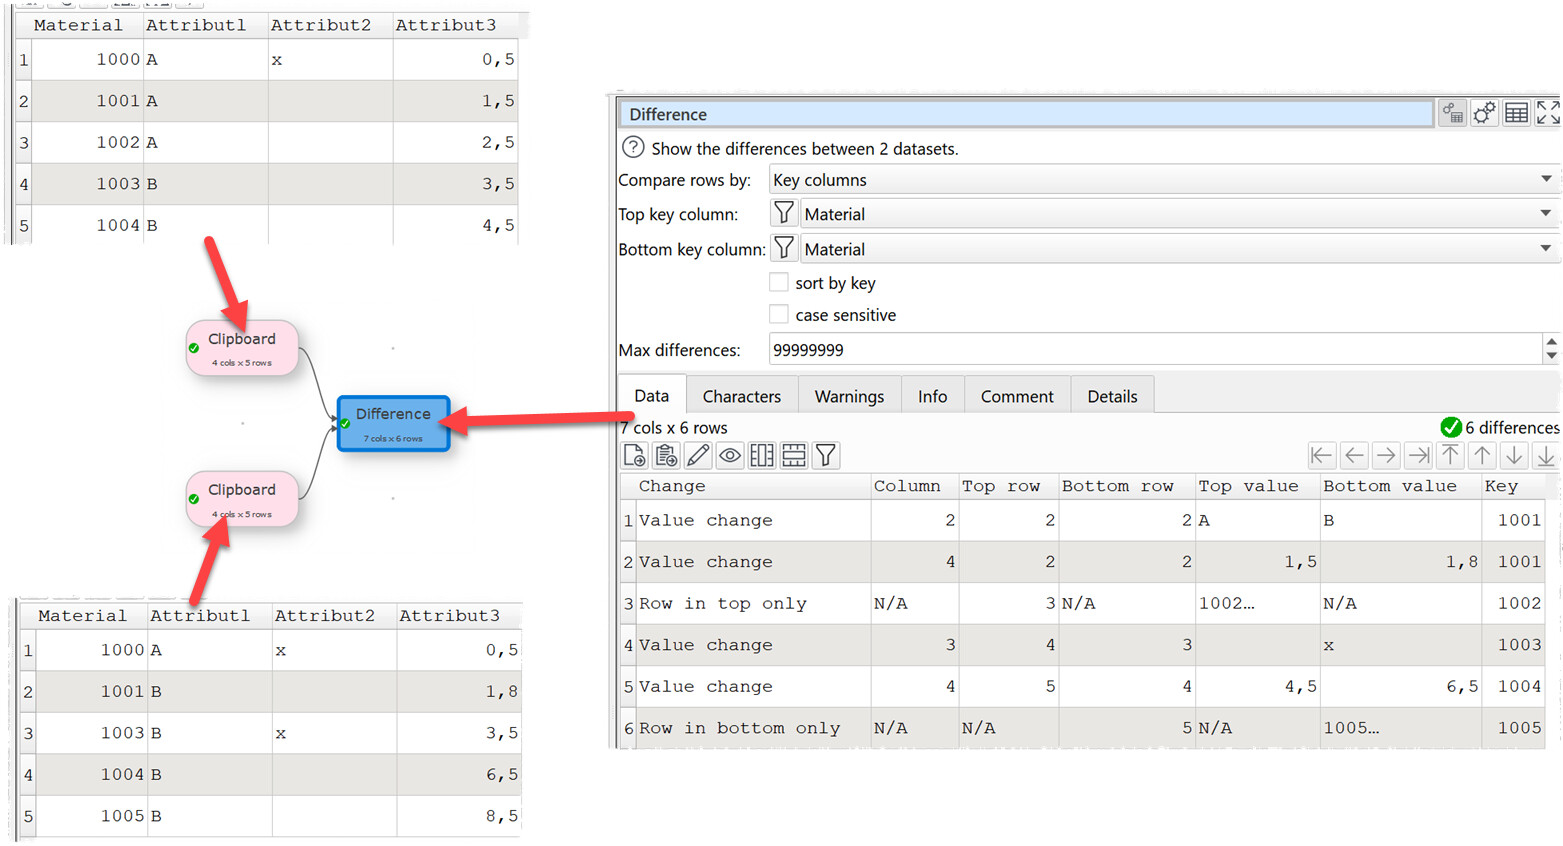
Options to compare by row number or key-based (as in Compare Data).
Key comparison can optionally be case sensitive (as in Compare Data).
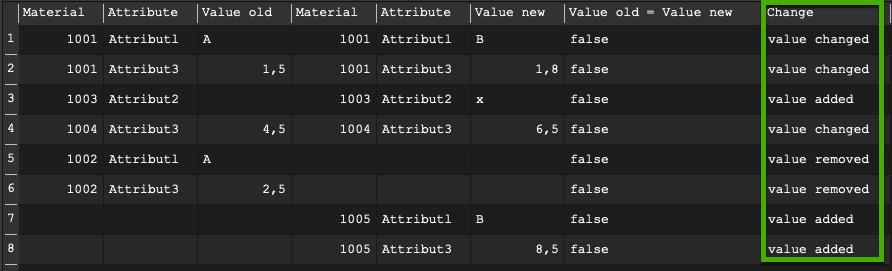
Only outputs differences, something like:
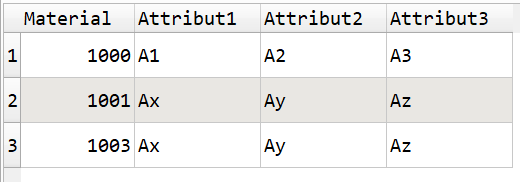
Material
Change
Column
Old Value
New Value
1001
Value changed
Attribut1
A
B
1001
Value changed
Attribut3
1,5
1,18
1002
Row deleted
1003
Value changed
Attribut2
X
1004
Value changed
Attribut3
4,5
6,5
1005
Row inserted
Would have to handle duplicate row keys for key-based.
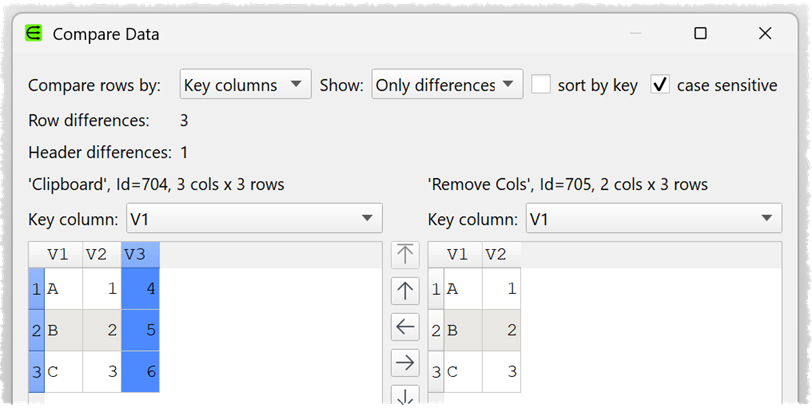
Would have to handle differences in column name/order. The columns are the same in your example, but we have to handle cases when they aren’t. How do you output the differences for this?:
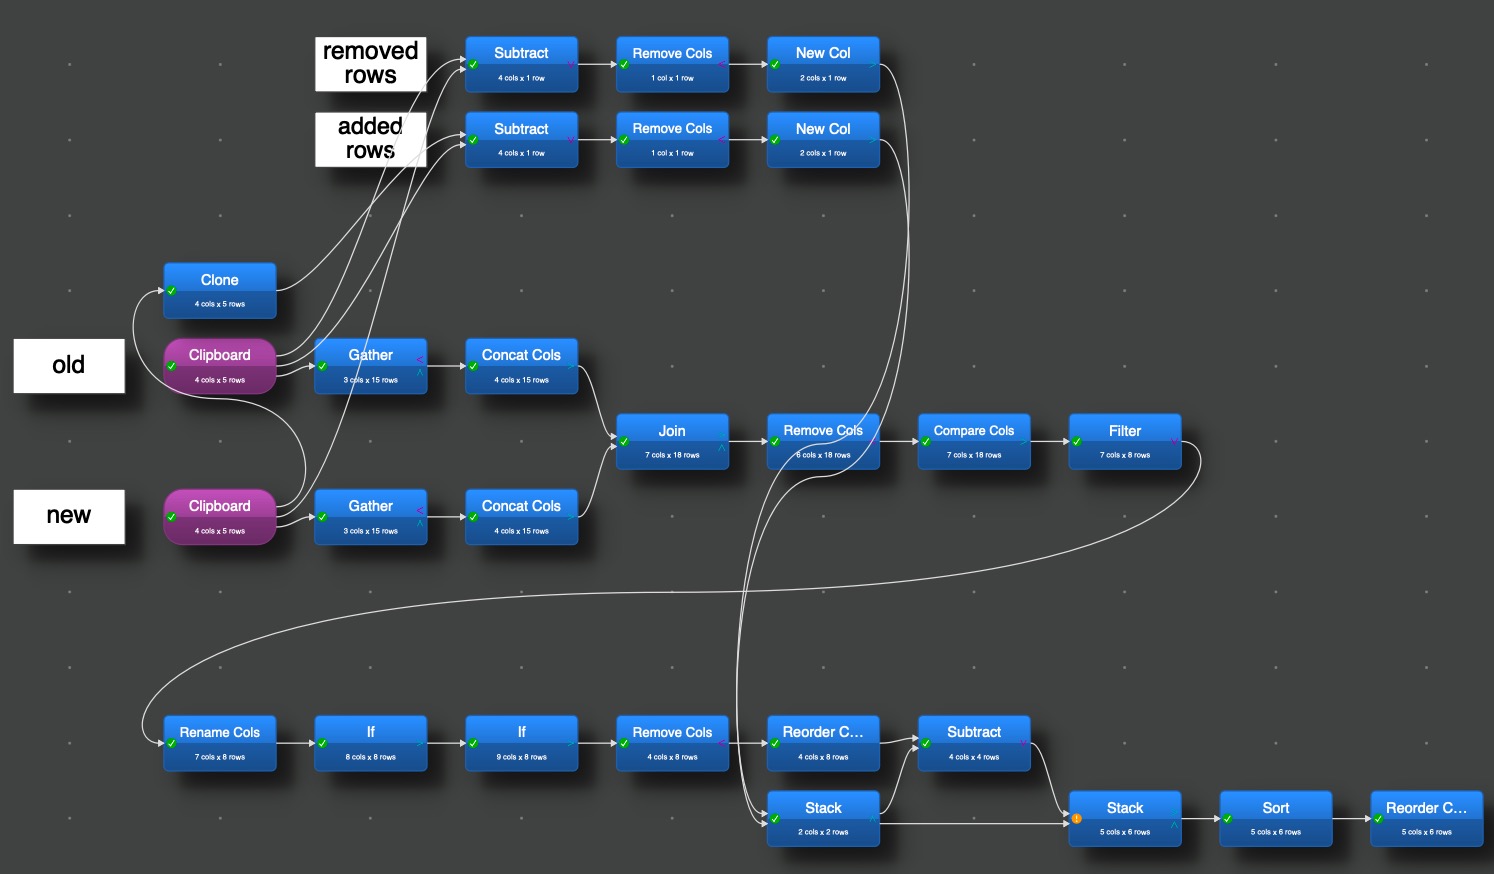
as long as the “DIFF” transformation is not available I have a suggestion for an interim solution, which can/should be adapted to get more close to the expectation. But I think it is a step to come to an overview in a table form as wished.
Since I currently also concatenate the contents of all fields, there is a difference for all rows as soon as a column is removed or added.
I have to edit this manually if I don’t want to see this.
If these differences could also be seen in the difference list, that would be the icing on the cake.
In the final difference list, the users could then even use the “Change” column to filter which differences they want to keep: “Value changed”, “Value removed”, “Row deleted” or “Row inserted”
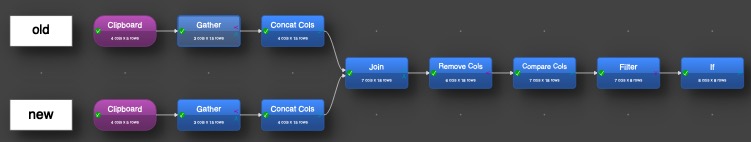
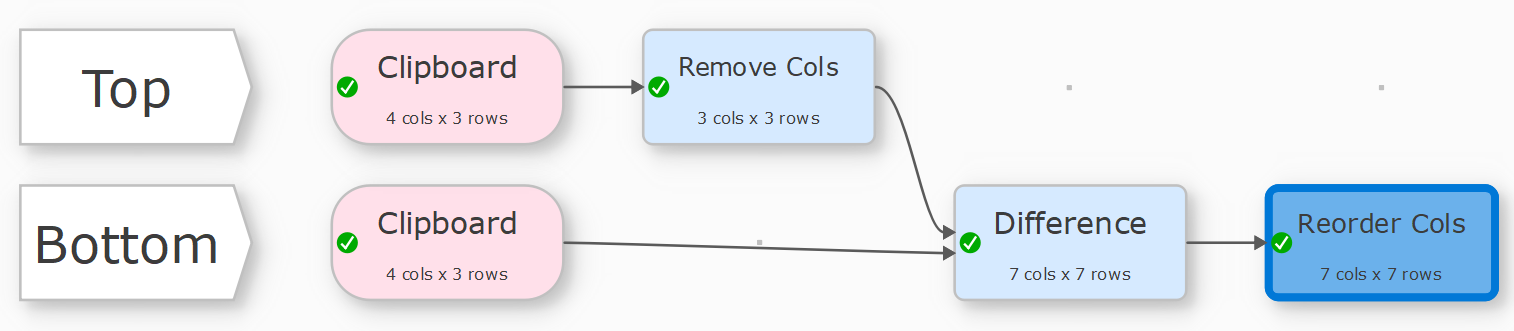
for larger input tables the selection in the Gather transformations need to be adapted, but if the structure of the file is very month the same it should work with 50+ attributes, too.
Sure, but as long it is not available and you have to do it monthly it worse to run the 25 transformation job. For a one-time activity it is a little much. But it was a nice finger exercise.
the interim solution was almost perfect, I only made small adjustments at the end to improve the display a little. The big solution was not necessary at all.
Now my 2 files with 100K rows and 59 columns each could be compared and only the differing columns are displayed.
It requires a whopping 12GB of memory, but it’s worth it
That sounds a lot. Have you got Preferences>General>Optimize processing for set to Minimum memory use? If not, you probably should. In many cases this is actually faster than Maximum speed, due to the reduced memory use.
… I tried both, but it didn’t make much difference.
At the “Gather” step we are already at 8GB and as soon as the two input streams with 5.4M lines each are combined via full join, another 3GB are required.
With “Maximum Speed” even 1GB less RAM is required
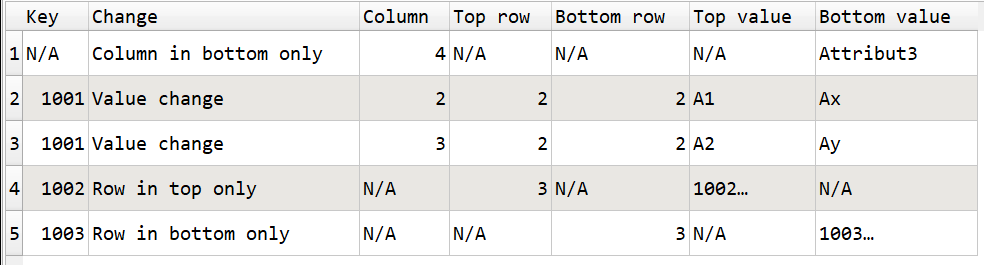
We are working on a new Difference transform. It can output a dataset of differences between 2 input datasets. The two input datasets can be compared by row number or using key columns. Columns are compared by column number (not name).
When comparing by column-no. it would be helpful if the column-names were also visible next to the column-number, so that we can see which attribute we are talking about in this line.
Is it possible to add an option to compare by column-names ?
If a column is missing in the middle (e.g. Attribut2), this is declared as a missing column and also as renaming the column and all the rows are shown as a difference …
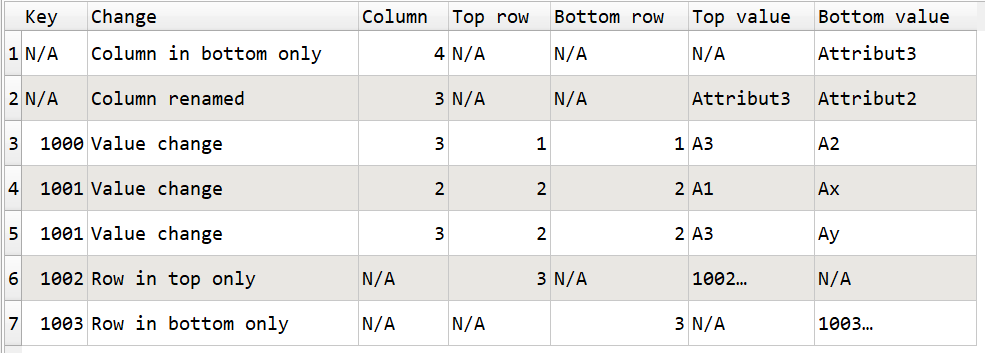
Perhaps. Until then you need to make sure the column ordering is the same in the 2 datasets. Note that you can do this by using Sample with Rows=0 to remove all the rows from one dataset (so it is only the header), then Stack the other dataset under it by column name.