There is a new snapshot release at:
Improvements include:
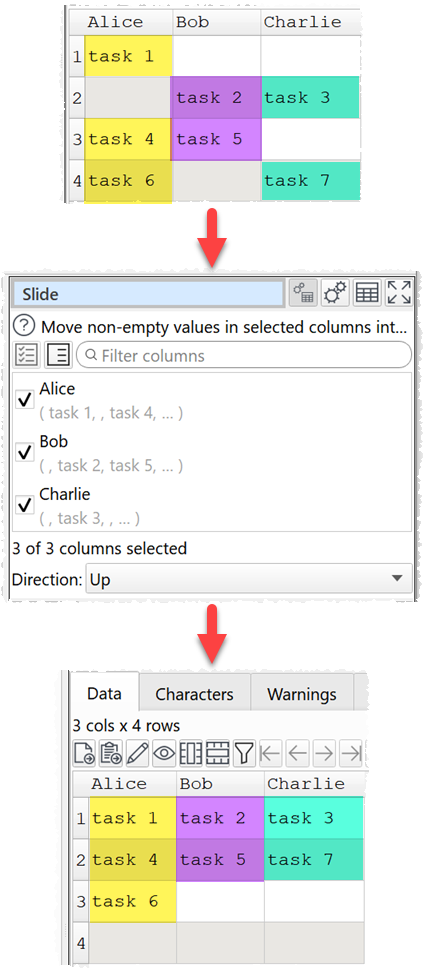
- A new Slide transform.
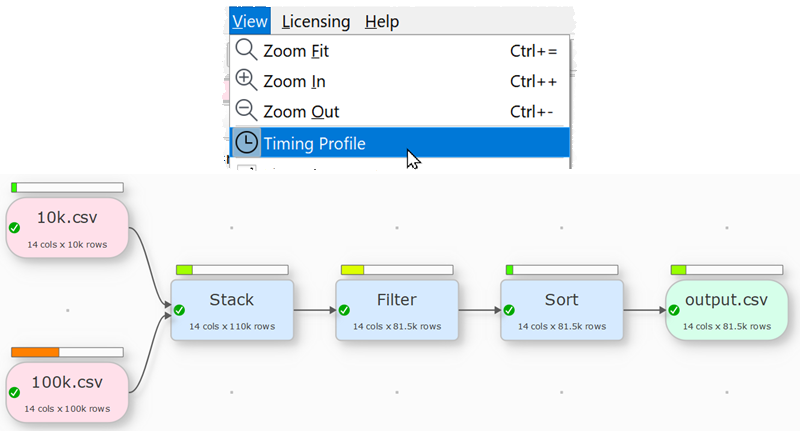
- A Timing Profile option.
Please try it and let us know if you have any issues.
There is a new snapshot release at:
Improvements include:
Please try it and let us know if you have any issues.
Hi,
strange version number for a snapshot release. When you execute the check for new versions your are told you have 1.42.0 and latest production version is 1.41.0 ![]()
But I have a question how is the new timing profile calculated? Is it a relative resource distribution between all transformations? I like the feature, but on my M1 MacBook nearly all timing is used by the I/O transformations. I have to zoom in to see any green on the other transformations and I tried different files which I use currently productive.
I it possible to select “view timing profile” permanently?
Thanks,
Olaf
It is a test snapshot for the v1.42.0 production release.
It takes the total time of processing of each input, transform and output, then it take the fraction of that total time. The colored bar length and the color are derived from the relative time for each item.
That is important to know then. No point in trying to shave 1% of a transform if the I/O is taking 50% of the time!
Currently, no. It adds a bit of clutter, so I don’t think you would want it on all the time. But in the production release you can toggle it with Ctrl+. .
I have to correct myself it is M2 CPU, and it is more that I/O has about 85 to 90%. Seems that M2 is fast as hell.
Thanks for the explanation, I assumed it to be like that.
We have put a lot of effort into making the transforms fast.
The structure of CSV files is such that it is difficult to read them fast. You can’t easily break the reading up between multiple threads as you can’t be sure that any particular character is quoted until you have read the whole file.
And Excel is, well, Excel.
Hopefully we will be able to support SQLite, DuckDB and Parquet formats in future versions. That should make I/O quite a bit faster, assuming you can get data in those formats.
Mac M1 and M2 chips are very fast. In an Easy Data Transform bechmark my 8GB Mac M1 Air was significantly faster than my desktop 16GB Windows AMD Ryzen 7 3700X 8-Core Processor 3.59 GHz from a few years ago.
The benchmark:
Mac M1: 8.31 seconds
Windows AMD Ryzen 7: 12.71 seconds
I have increased the size of the profiling bars a bit. I did think about coloring the whole item instead, but this causes other issues:
Hi Andy,
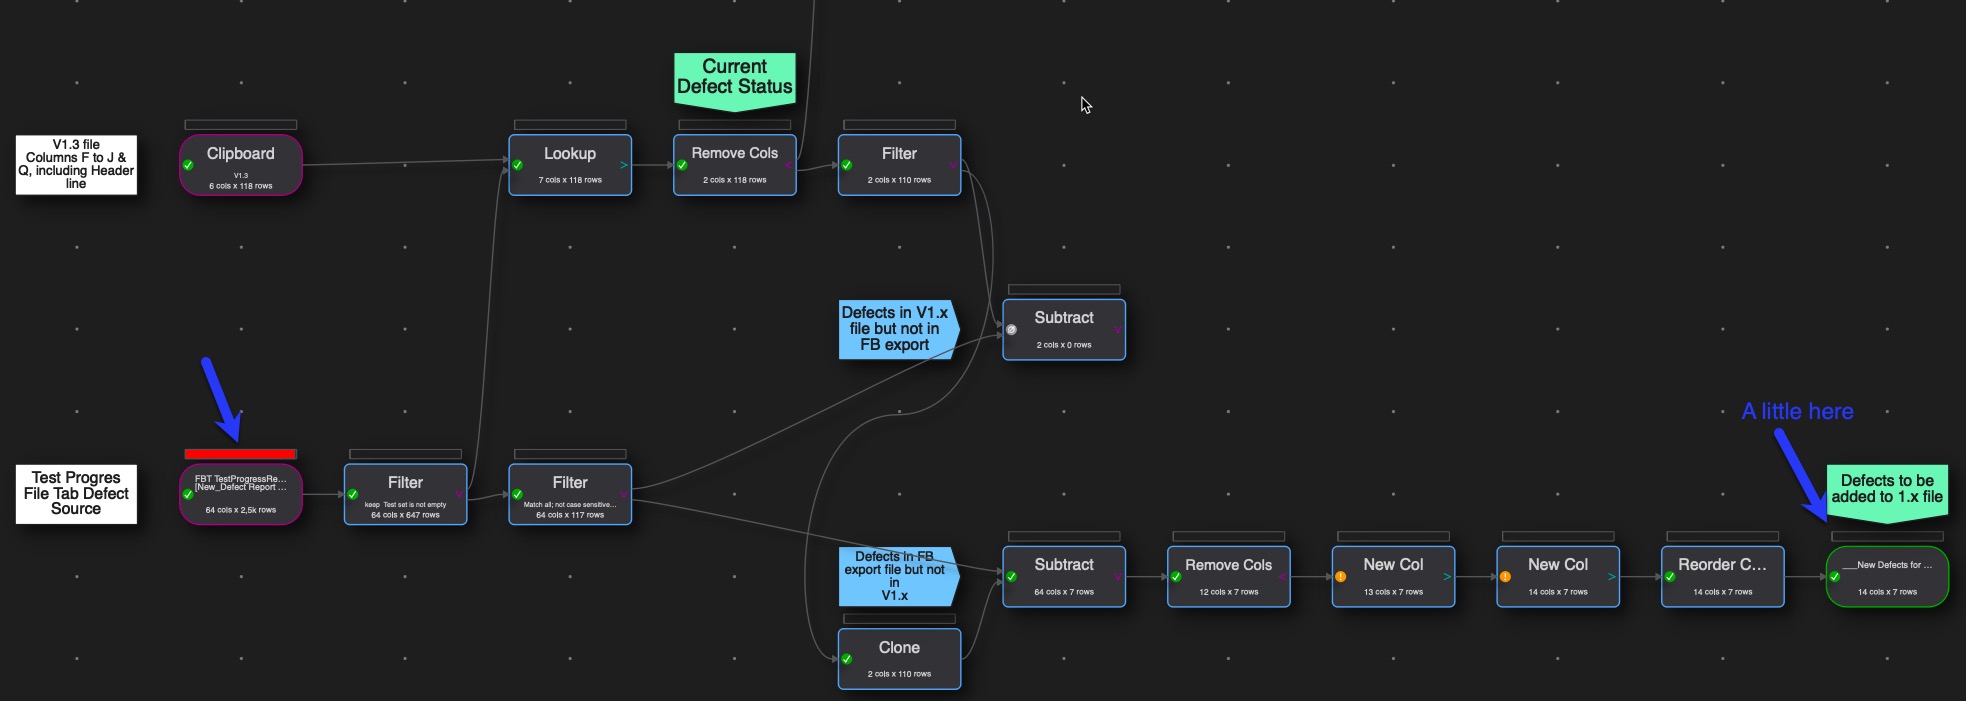
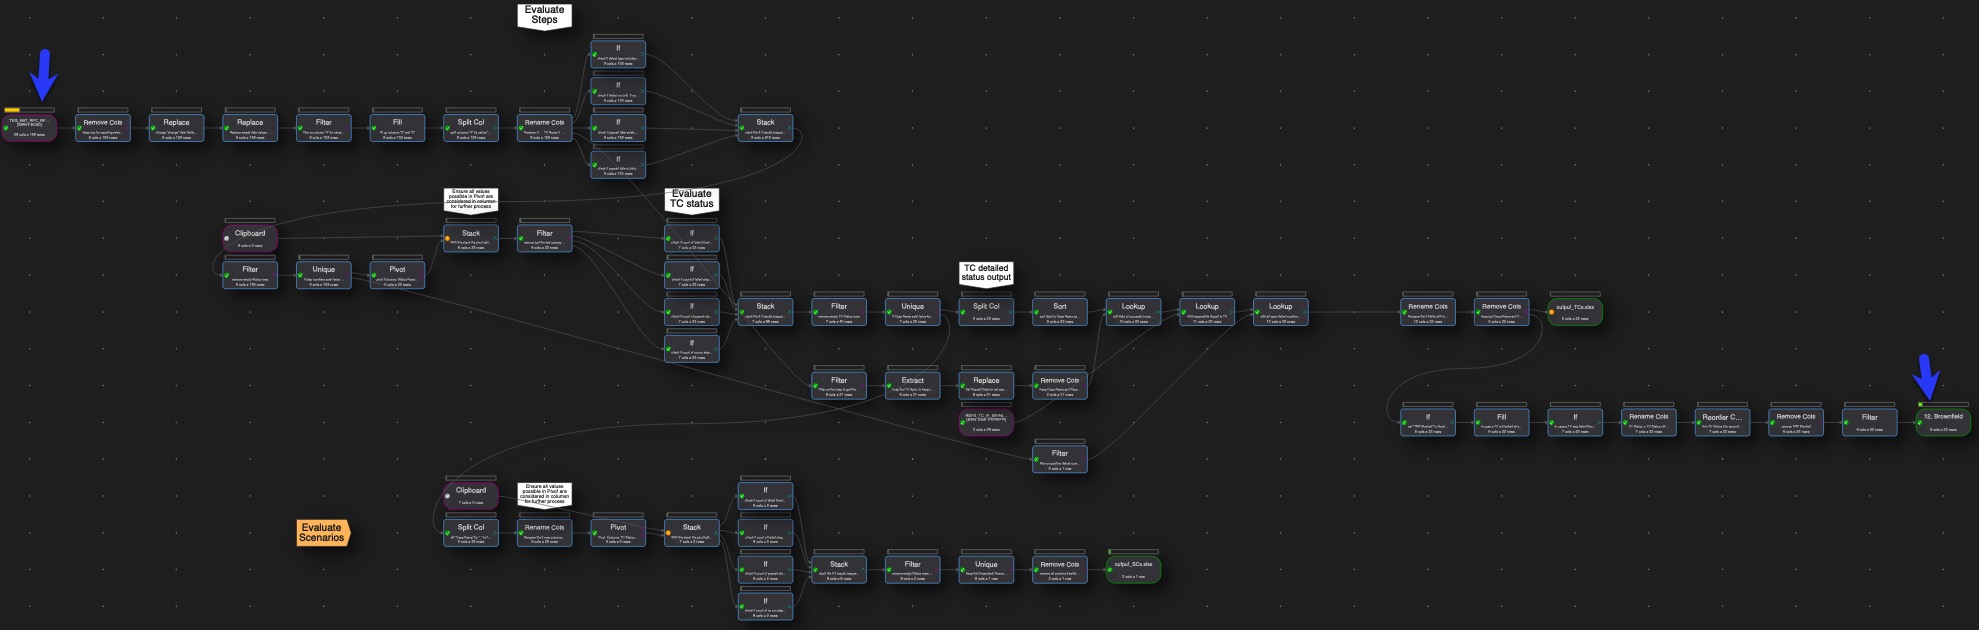
the problem was not the bar itself, it was the distribution of resources between the transformations, that I nearly didn’t see any use at the calculations, as I/O used most of it. Here are some examples:
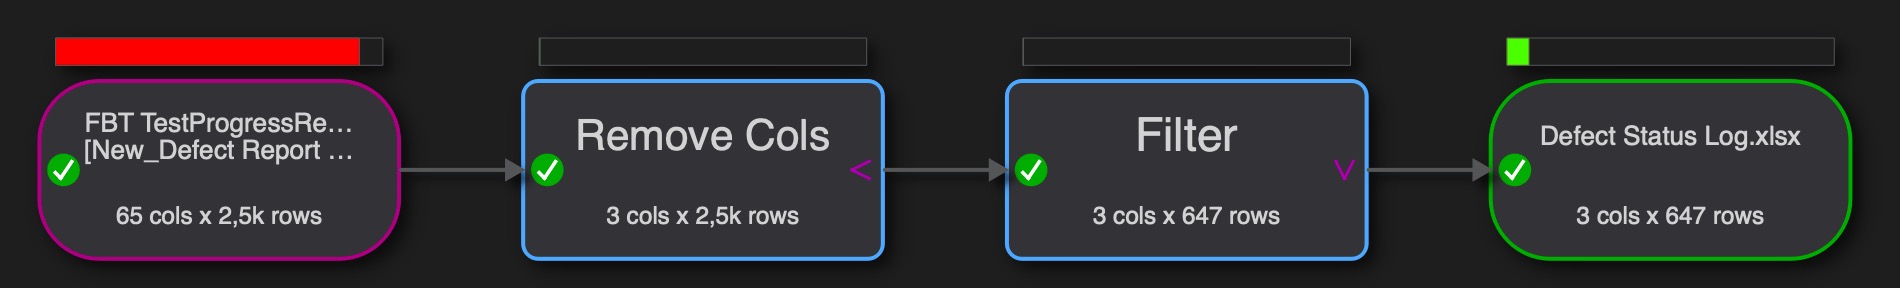
and a very simple one:
Maybe color the bars in grey when not processed.
Reading from Excel is slow. We are using a third party library for reading Excel and I doubt it is possible to do it much faster. At least you can see that is where all the time is being taken.
No problem with the Excel, all the other parts are really fast, but it lead to nearly no time portion presented in the other parts. We discussed it already above.
I don’t know how complex the implementation is, but maybe it is possible to have 2 different types for the timing profile, one as is and another one showing the same but excluding the I/O functions, as they cannot really be influenced when somebody builds the own flow.
The implementation is not hard. The issue is to how to present it in a nice clean and simple way on the user interface. Currently it is just toggle on/off.
Yes, there could be a option hidden in Preferences, but is not very good UI design.
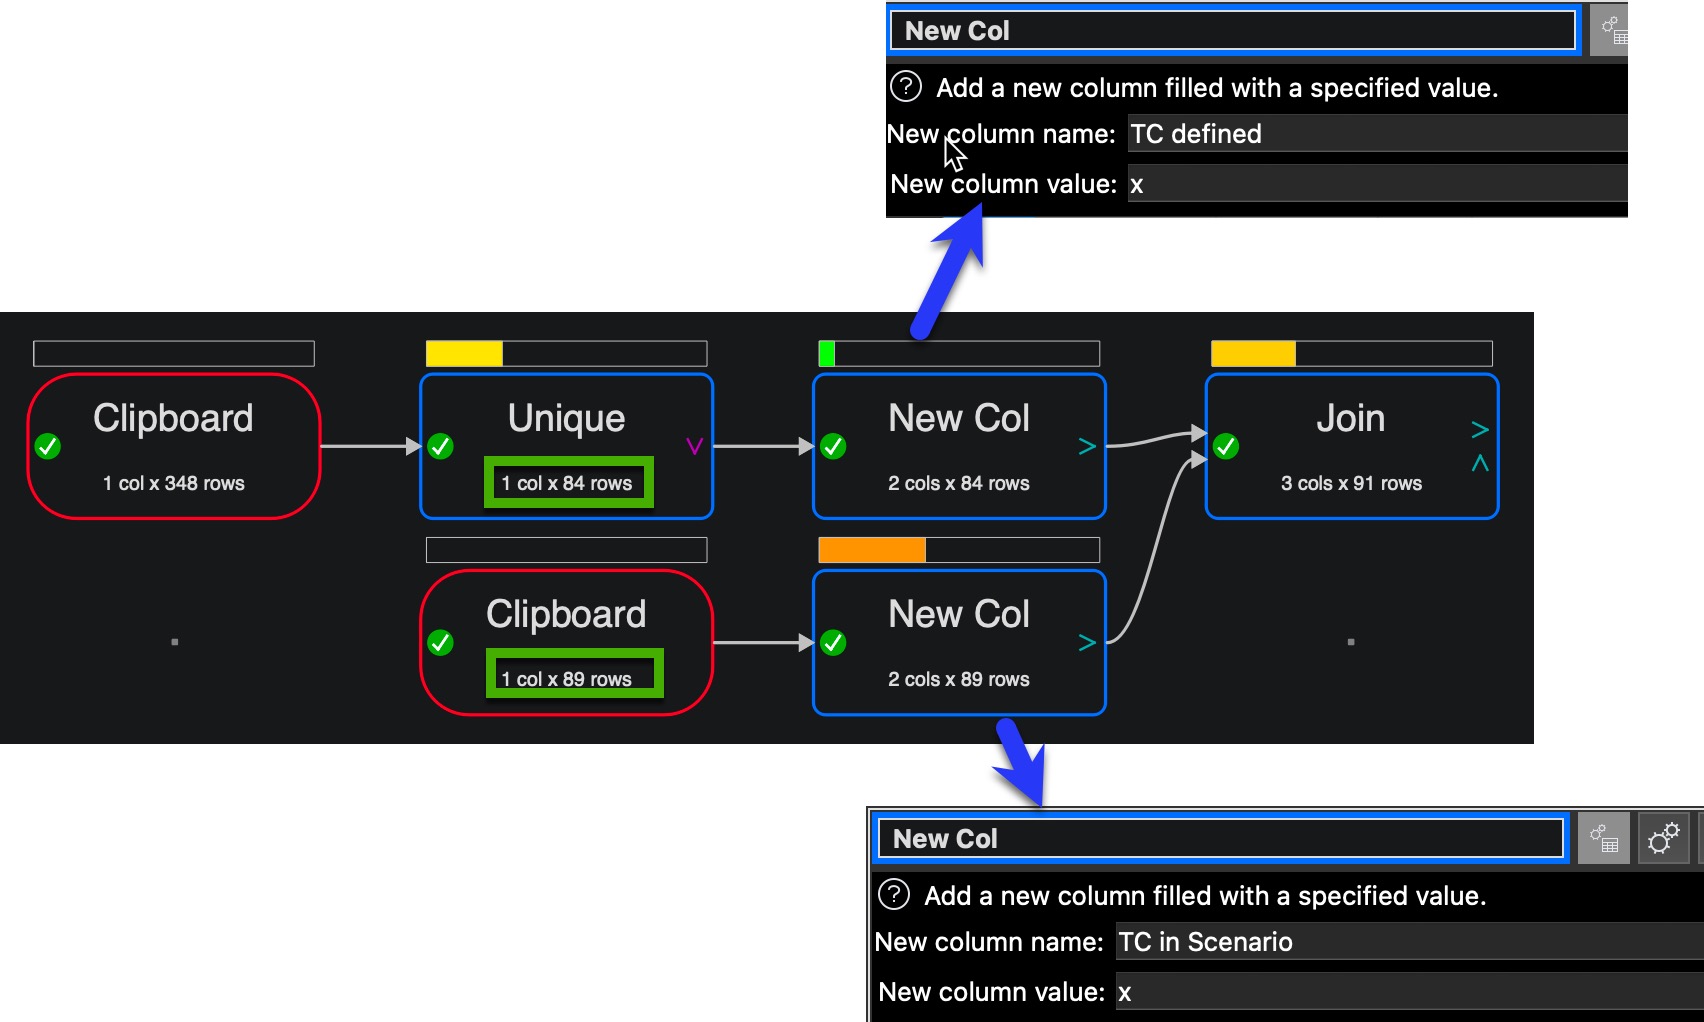
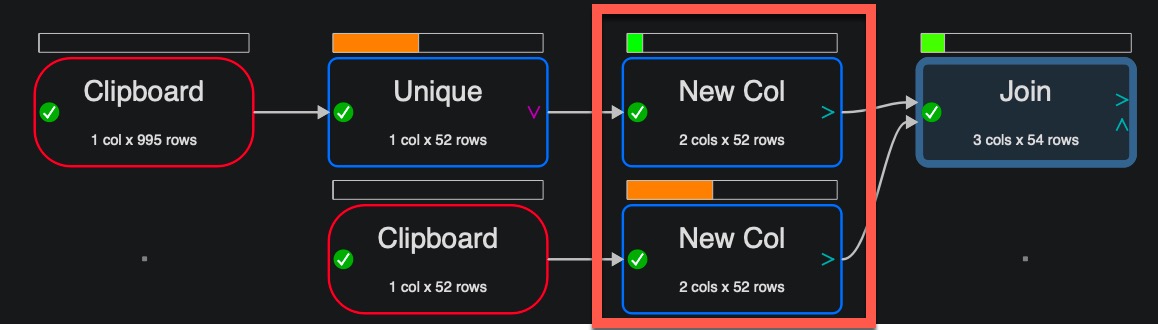
Question as I’m just curious, I have a small transformation to compare some aspects in 2 tables, not big data at all, but I’m astonished about the shown behavior of the Timing profile.
I add to tables a column (New Col) just with a marker - value “x” - and the shown Timing profile differs significantly. Which I wouldn’t have expected. @Admin: Do you have an idea and can explain it?
Here to examples (screenshots) in the first the numbers of rows is minimal different in the second it has the same number of rows.
@Olaf I think the datasets are so tiny that the timing numbers are fairly meaningless.
you are right, I didn’t think about this