Hi
I am trying to get some sales aggregation by product over time done and was wondering if that’s possible in EDT or if I need to write it its own program.
I have a spreadsheet which has the input on the top area and the desired output on the bottom: https://docs.google.com/spreadsheets/d/1iE5LojPIXZ7PrxLoc2-XZicRQKb_dpvRYgXZHLC1j9w/edit?usp=sharing
The input has individual sales records and the output should have sales in a period of each product.
Here is a sample dataset of the relevant input columns:
Product,Date,Units Sold,Unit Cost,Unit Price,Total,Profit
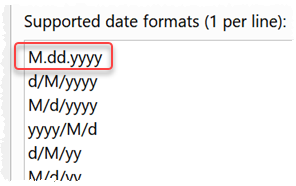
2,04.06.2022,1,1.39,5,5,3.61
2,04.06.2022,1,1.39,5,5,3.61
2,04.06.2022,1,1.39,5,5,3.61
2,05.01.2022,1,1.39,5,5,3.61
3,04.01.2022,1,2.09,5,5,2.91
4,04.06.2022,1,1.53,5,5,3.47
4,04.06.2022,1,1.53,5,5,3.47
7,05.01.2022,1,1.64,5,5,3.36
7,04.06.2022,1,1.64,5,5,3.36
8,04.06.2022,1,0,5,5,5
8,05.01.2022,1,0,5,5,5
8,04.01.2022,1,0,5,5,5
9,04.06.2022,1,0,5,5,5
9,04.06.2022,2,0,5,10,10
9,05.01.2022,1,0,5,5,5
9,05.01.2022,1,0,5,5,5
9,04.06.2022,1,0,5,5,5
9,06.01.2022,2,0,5,10,10
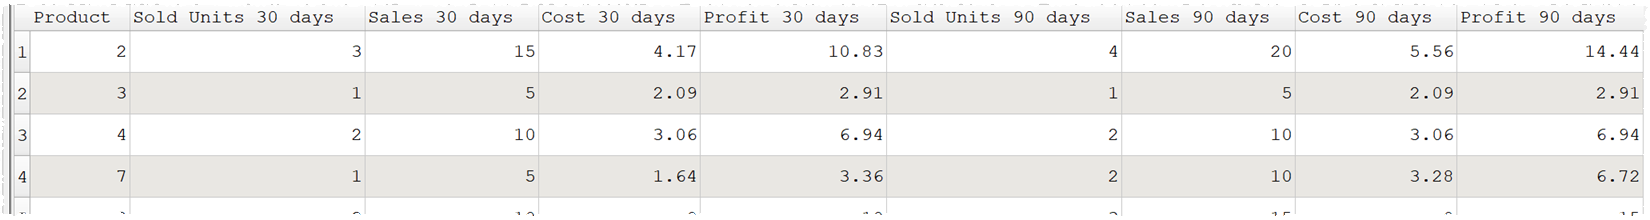
And the output sample:
Product,Sold Units 30 days,Sales 30 days,Cost 30 days,Profit 30 days,Sold Units 90 days,Sales 90 days,Cost 90 days,Profit 90 days,Sold Units 180 days,Sales 180 days,Cost 180 days,Profit 180 days,Sold Units 365 days,Sales 365 days,Cost 365 days,Profit 365 days,Sold Units 730 days,Sales 730 days,Cost 730 days,Profit 730 days
2,3,15,4.17,10.83,4,20,5.52,14.48,4,20,5.52,14.48,4,20,5.52,14.48,4,20,5.52,14.48
3,0,0,0,0,0,0,0,0,1,5,2.09,2.91,1,5,2.09,2.91,1,5,2.09,2.91
4,……,
7,……,
8,……,
9,……,
Any hints would be appreciated.
Thanks
Mark