Playing with Time Slices

Hello all, according to you, when you have multiple time slices:

|Date from|Date to|
|2023-01-01|2023-02-01|
|2023-01-01|2023-01-02|
|2023-02-01|2023-03-01|

And you want to get a view with values:

  • per Day;
  • per Month;

What is the preferred approach to do that please?
Thanks, Oliver
example 28-02.csv (1.6 MB)

@oliv_reg
It isn’t clear to me what output you want. If you input:

|Date from|Date to|
|2023-01-01|2023-02-01|
|2023-01-01|2023-01-02|
|2023-02-01|2023-03-01|

What would you expect to output?

Hello Mr Andy,

Two different outputs/views please:
image

At the end both sums are egal.
Regards, Oliver

Sorry, I’m sue it is totally obvious to you, but I don’t understand how the input and output are related.

If you want to sum over day and month, can’t you do that by doing a Pivot on the year/month/day and a Pivot on the year/month?

Yes I may sir but that leads to some incoherencies. Because some time slices last 1 day (case A), some X days inside the month or not (case B), some 1 month (Case C), some X months (case D).

A monthly or daily view implies to transform all: time-slices should last 1 day each (eg. 1 row valid for 1 month is transformed into 30 daily rows and the value is /30). Then when I pivot I get clean results in one shot, that would be ideal.

Currently inside a transformation I fork per case (A, B, C, D) then I regroup all at the end, but I am not satisfied with this approach.

Can you use Sequence to add rows so that each row is 1 day?

1 Like

I guess Sequence only works if there is just 1 sequence in the dataset, not multiple.

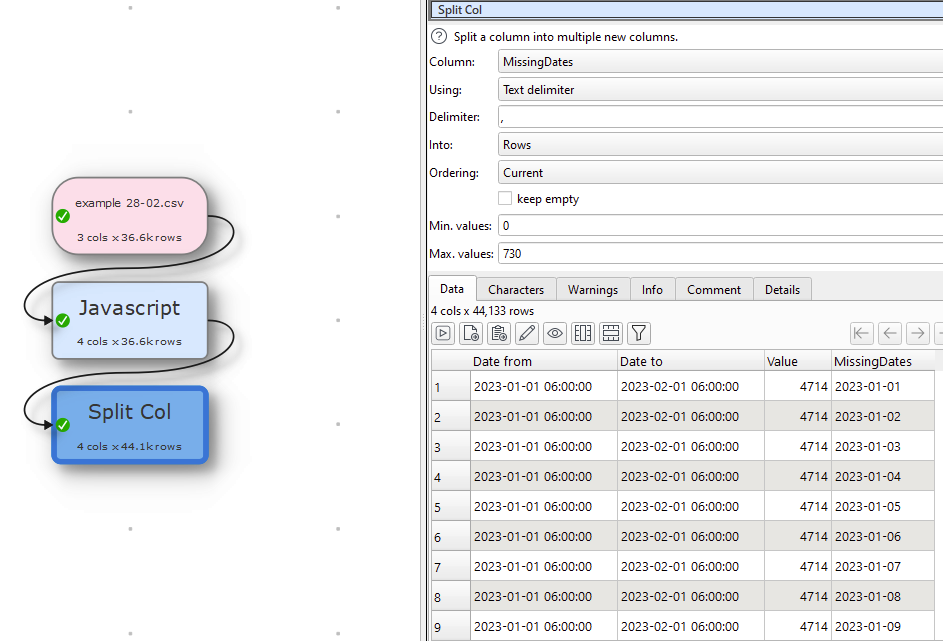
So maybe split each row into a separate dataset using Filter or Slice. Use Sequence to expand all the dates. Stack them all back together and then use Pivot to make a summary.

1 Like

Two different outputs/views please:
image

I don’t get it, what does the 2 value columns stand for with the values 100 and 2? Do you intend to get the difference between the 2 dates?

Hello Mr Olaf,

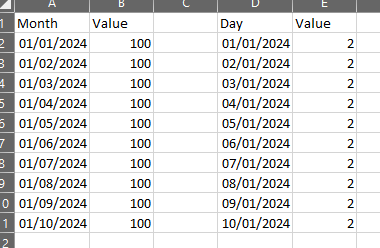
In the CSV I get there are “From & To” periods like: “2 Jan to 7 Feb, value X” or “1 Jan to 31 Jan, value Y” or value valid for 1 day (and many other combinations). Then Sales department expects to get two reports. One where you see values per day and one where you see values per month.
If you pivot the from dates only it gives incoherent results. What I have to do is “to deconstruct” all from/to rows into strict values per day (1 row 1 day 1 value), then make a SUM per day and a SUM per month.

I think Mr Andy (the Admin) gave above the correct way to proceed: Slice, Sequence, Stack, Pivot.

Regards, Oliver

That is great Mr Andy, your suggestion is what I was looking for, thank you!

1 Like

There might possibly be an easier way if Stats could return maximum and minimum dates, but currently it only works with numbers.

2 Likes

Hi @oliv_reg

Here is my take on it, I transform all Date From to Date to by adding missing dates between them

But don’t understand what is next, if you can explain further, maybe I can help further.

Transform file
PlayingwithTimeSlices.transform (2.9 KB)

You need your original example 28-02.csv file as I took that as an input.

2 Likes

Very nice trick, I recycle it! Thank you Mate!