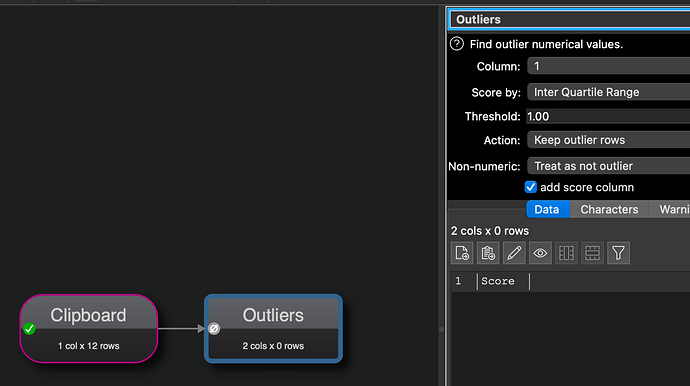
I am curious to know why the Outliers transform does not permit threshhold values < 1. Leaving aside the question of travesties of statistics, it would be functionally useful.
It didn’t occur to us that anyone would want to reject something within the Inter Quartile Range. Please tell us a bit more about why you would want to do that.
The purpose is not statistical. It is trimming some financial data while exploring all-of-market data for companies. The following transform is by way of illustration of the problem or question:
outliersDemo.transform (1.8 KB)
and the Info from Outliers:
12 numeric values
Quartile 1=19.5
Quartile 3=93.5
Inter Quartile Range=74
Lower fence= -54.5
Upper fence= 167.5
This is fine given the uniform distribution with no statistical outliers, but does not accomplish capture (or exclusion) of anything in Q1/Q4, which would be accomplished if Threshhold=0 and could be adjusted arbitrarily with values between 0 and 1.
This is related to my earlier discussion of cutting arbitrary percentiles. Flexibility of Threshhold in Outliers could do in one step what otherwise takes four. The main obstacle I see is that the term “Outliers” then has its proper meaning smeared.
Understood. Would it be easier with percentiles, rather than IQR?
Yes. It would be nice to have more flexibility on percentiles in EDT. There is the existing alternative of normalising the distribution then using z scores.
Incidentally, in case anyone runs it, the tiny transform I posted is mysteriously missing its column selection compared with the actual. The information is correct.
I must have fiddled with my local copy after posting. I knew the results were correct.

