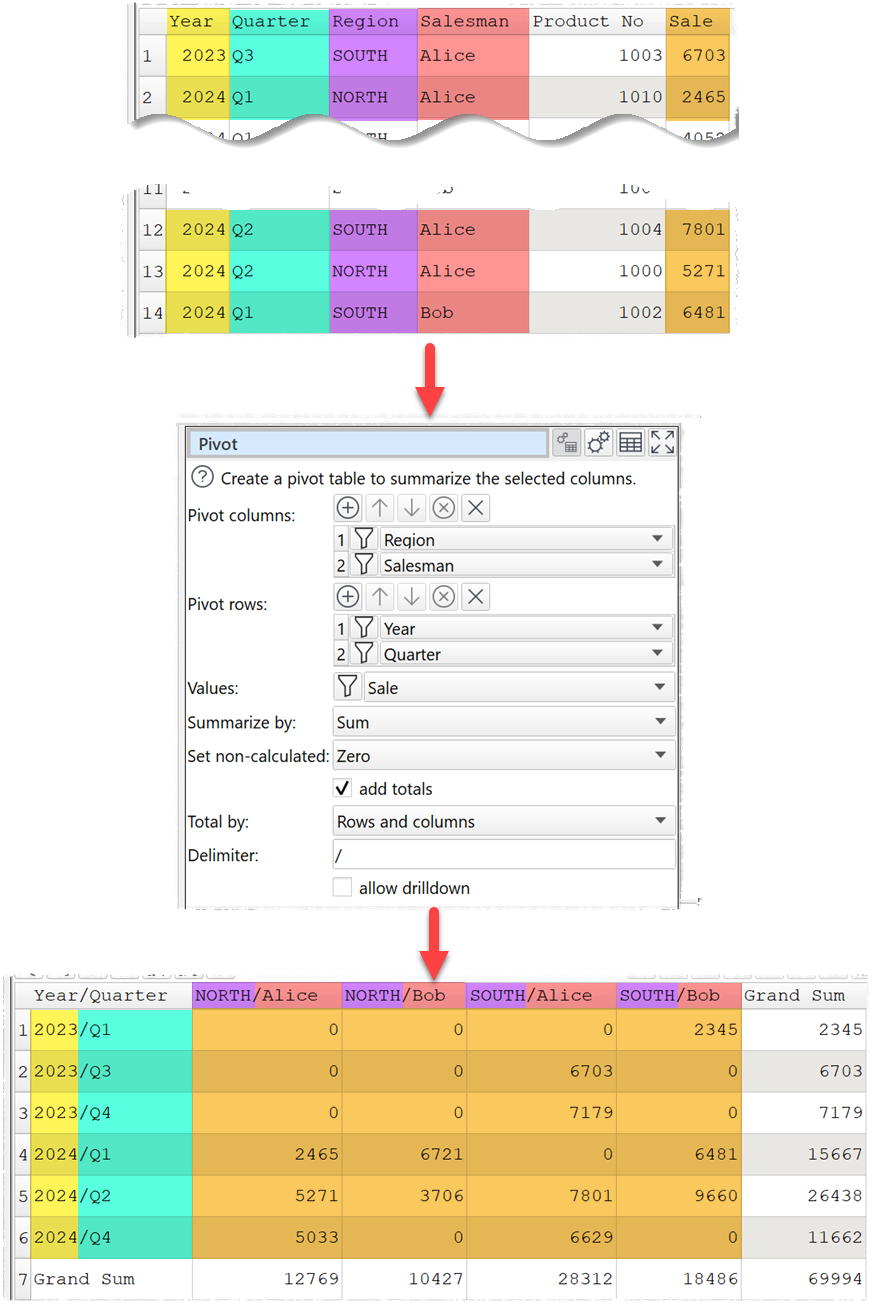
"Hello! I’m currently working with a table, and I’m exploring the possibility of implementing a multi-level pivot functionality, akin to Excel pivot tables. I’m interested in summarizing data at different levels based on a specific field.
While experimenting with concatenating columns to achieve this, I encountered a challenge when attempting to split the concatenated values using the ‘split cols’ function. Unfortunately, ‘split cols’ operates on individual columns, which could become cumbersome when dealing with multiple columns.
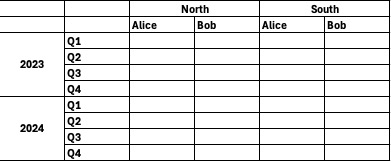
As a feature request or suggestion, it would be fantastic to have a mechanism similar to Excel’s functionality. For instance, the ability to drag and drop the pivot column (or row) for easy organization, and the option to nest aggregations for a more flexible and intuitive data summarization experience. This could greatly enhance the efficiency and user-friendliness of the tool. Thank you!"
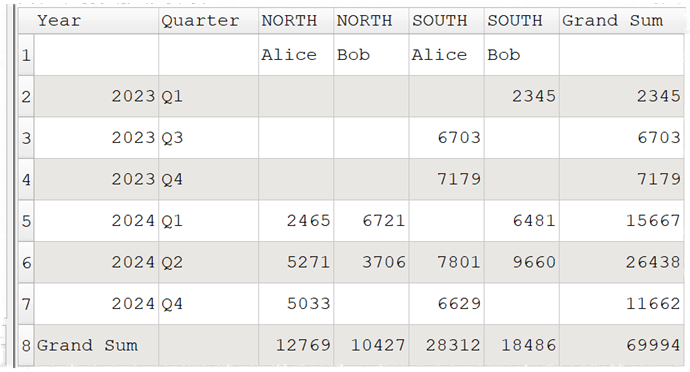
I have to think about a solution for nicer presentation of multiple levels in the columns, to get multiple header rows. For rows it is “easy” with split column to reach something like:
did meanwhile the same with some transpose, split column, reorder, rename and so on. And in case the data has to undergo further transformations it becomes impossible.
So in case the date is required for management presentation the presentation Fien tuning must be done in a different tool. But the implementation done is big improvement
I don’t see an issue with the alphabetic order that can be handled easily with Stack, which I use a lot after pivot. As with pivot values get lost in case they are not in the data in current occurrence, but I want to show all possible columns evens thy are empty in that moment. And I can ensure with stack a stable order of the columns.
It is more the issue for Management you need to show the 2 or 3 rows header, for normal work, I don’t need it. But I thought during writing this on an idea. I would ensure as written above with stack on a stable row order. Create a nice view in a presentation tool (event Excel) and just copy over the data content. First column can be handled with split column and reorder easily.
Here for those, which might be not that familiar an what I tried to explain and have a need for stable output, too.
The Clipboard transaction just includes a table with header names I need in the oreder I would like to have them.
The pivot doesn’t have all possible values which can occur for that sort of data (which is stated in the clipboard header list.
With Stack I get a table with all values and in the order I would like to get it.
We could have Pivot show column/row header values in the order they are encountered in the input (rather than alphabetical order). But that won’t happen this release.