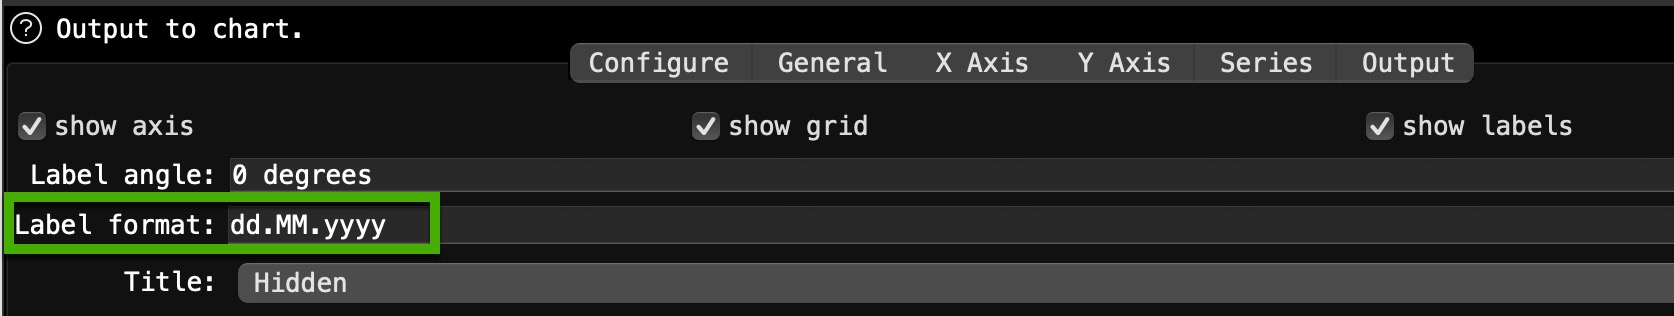
I like the possibility to use in some charts the date format, specially it is possible to define the format for the labels without changing source data:
But I recognised another effect with the date format, it fills the x-axis with values not in source data to get equal distances between the dates, which is helpful in some cases, but sometimes it is not intended to happen and show only the dates with data. For sure text as a format for x-axis is an option, but it might require to change the date format for the x-axis field. Is it possible to extend the chart treatment with a selection to show only existing date values on the x-axis? E.g. in case data is presented for working days, the graphic should not show the dates of the weekend (Saturday and Sunday) which doesn’t include data.
We are using a charting library and I don’t think it offers the option to hide/omit some dates (e.g. Saturdays and Sundays). But you should be able to handle this by treating the date value as ‘text’. You just might need to do some sorting and reformatting before the chart.
Thanks for the explanation. I was aware of the alternative, tried it already, before I wrote the post. If the limitation is from library, it is o.k.
The weekends were just an example, I was just looking for a possibilty to use just dates which are in the data. But the potential two steps, reformating date to the presentation intended and sort before using the chart with text format are feasible.