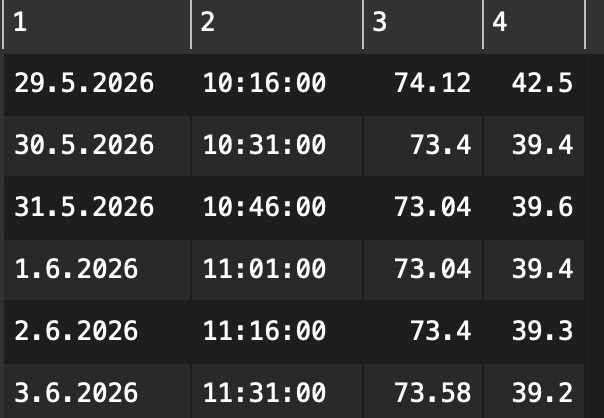
I have a dataset with three columns: [1] date and time; [2] temperature; and [3] humidity. I want the x-axis to be the date/time, but I cannot get EDT Advanced to recognize the format. I have tried several transformations but I can’t find one that is recognized by the Chart block.
I am including a few rows of my dataset. Any insight is greatly appreciated. I hope I am not overlooking something silly.
I tried to upload my .transform file but was not allowed as a new user.
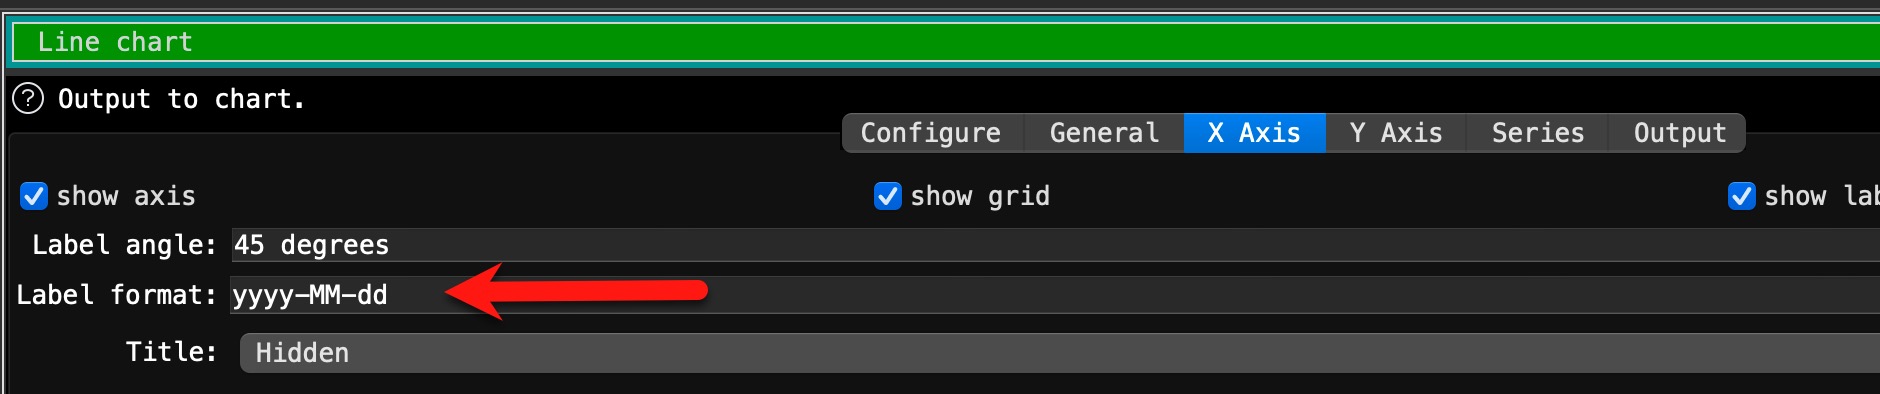
In case you have a column including date and time it is interpreted as text for the x-axis.
The date format is only used for plain dates without time. Possible date formats are described in documentation, too (just check the the “?” (help) in the chart transformation.
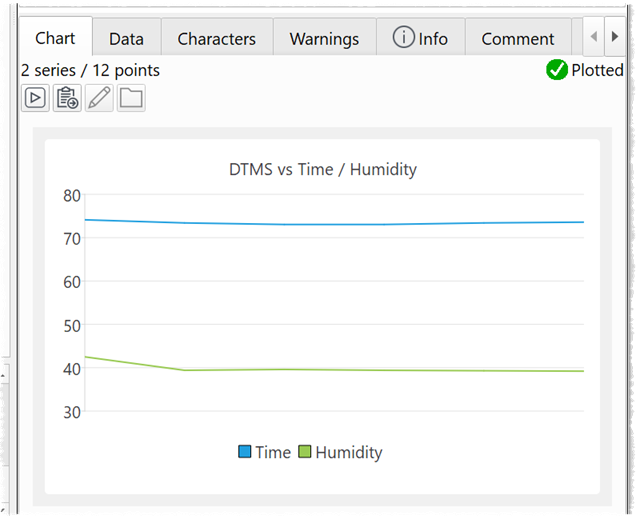
And your example date doesn’t show any senseful charts even if you split out the dates only, as all dates are the same and chart transformation doesn’t know how to interpret identical dates.
I manipulated the dates and leave them in an own column
then it shows the above label format (I ignored the time). Date format is changed as I work on a German configured system. The resulting chart shows a minimum range of dates, which is more than in the data. See attached file
Top part is chart with dates as text format. Botton part use the dates only, were I manipulated the dates to be unique, just to show the functionality.
Thank you! I appreciate you taking the time to help me.
In a perfect world I would love to have the x-axis represent both a date and time, so that the data look correct even when I don’t have evenly spaced samples.
It might get quite tricky. Specially as you have 15 minutes steps. There are limitations in line charts about the number of data points.
Just an idea. You can create a range of dates, using Sequence transformation. I created time range in Excel (15 minute steps). @Admin, is there a possibility to create this in EDT?
This two tables I joined with cross, concatenated Date and time and stacked it with your source data. After sorting by date_time it will show more or less evenly spaced data. But even in my example with just 4 days you have 390 data points for the x-axis and it gets unreadable. Even if you filter to just one day, it is not a good presentation result as x-axis label are not readable.
Currently the X axis supports dates, integers, reals and text values, but not datetimes. However you can convert a datetime into an integer number of milliseconds. See the last example here:
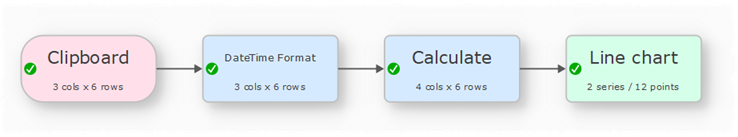
You need to convert your datetime to an ISO datetime. Here is an example with your data: