We rather enjoy the glorious spectacle of high camp that is the Eurovision song contest. The voting is always a bit suspect, but this year it seemed particularly strange, with little apparent correlation between the public and jury votes. So we broke out Easy Data Transform and did some data wrangling of the last 10 years of results, to see if the voting pattern was different this year.
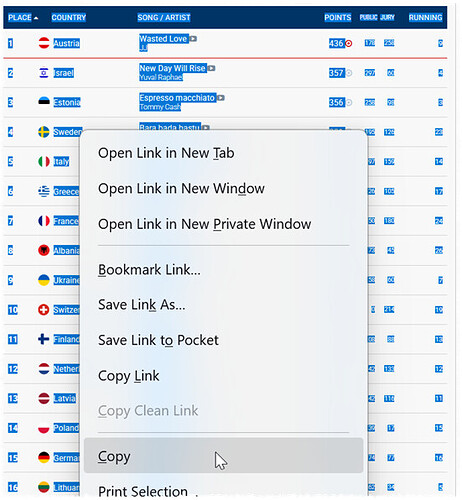
We copied the data table Eurovision 2025 Results: Voting & Points and pasted it into a Clipboard item :
Then did a few transforms to knock it into the correct shape. Then we used Correlate to calculate the Pearson correlation between the jury and public votes for each competitor in the final.
We then repeated the process for each year. We used Duplicate branch to duplicate all the items and then pasted a new set of results into the Clipboard.
Here are the results:
| Year | Pearson correlation jury vs public scores |
|---|---|
| 2025 | 0.160 |
| 2024 | 0.627 |
| 2023 | 0.490 |
| 2022 | 0.467 |
| 2021 | 0.618 |
| 2020 | N/A |
| 2019 | 0.441 |
| 2018 | 0.255 |
| 2017 | 0.656 |
| 2016 | 0.447 |
2025 is clearly an outlier in terms of a lack of correlation between jury and public votes. Concerted social media campaigns perhaps? Or something more nefarious? Who knows.
Here is the .transform file, in case feel like doing some digging into the data.
eurovision.transform (37.9 KB)
If you do, let us know what you find!

