We have had a couple of requests for Sankey diagrams. They currently aren’t high on the wishlist because:
- They are quite niche.
- They don’t fit very well with data in a tabular form or with the user interface to the existing charts.
- They are not supported by the graphing library we use.
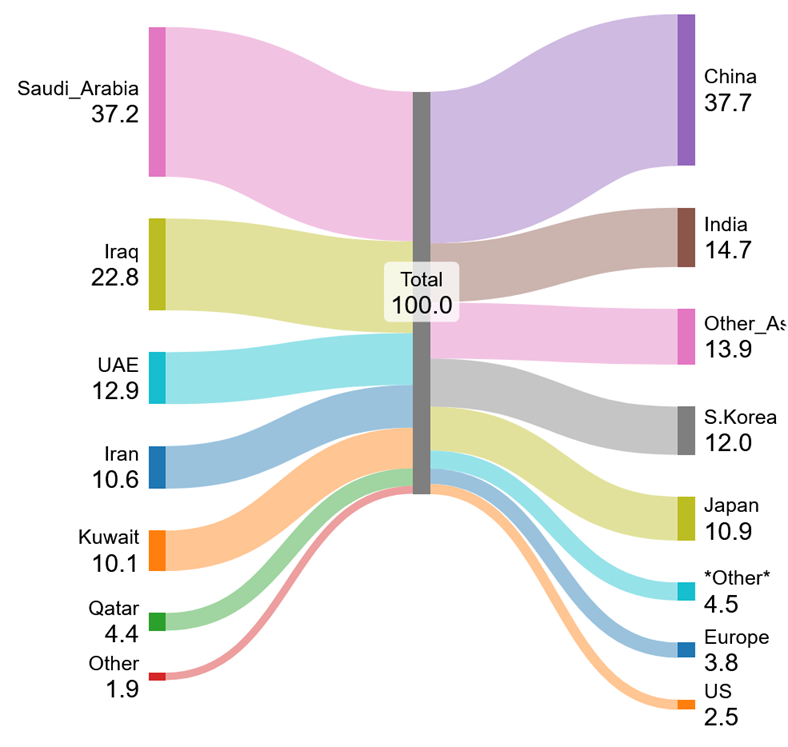
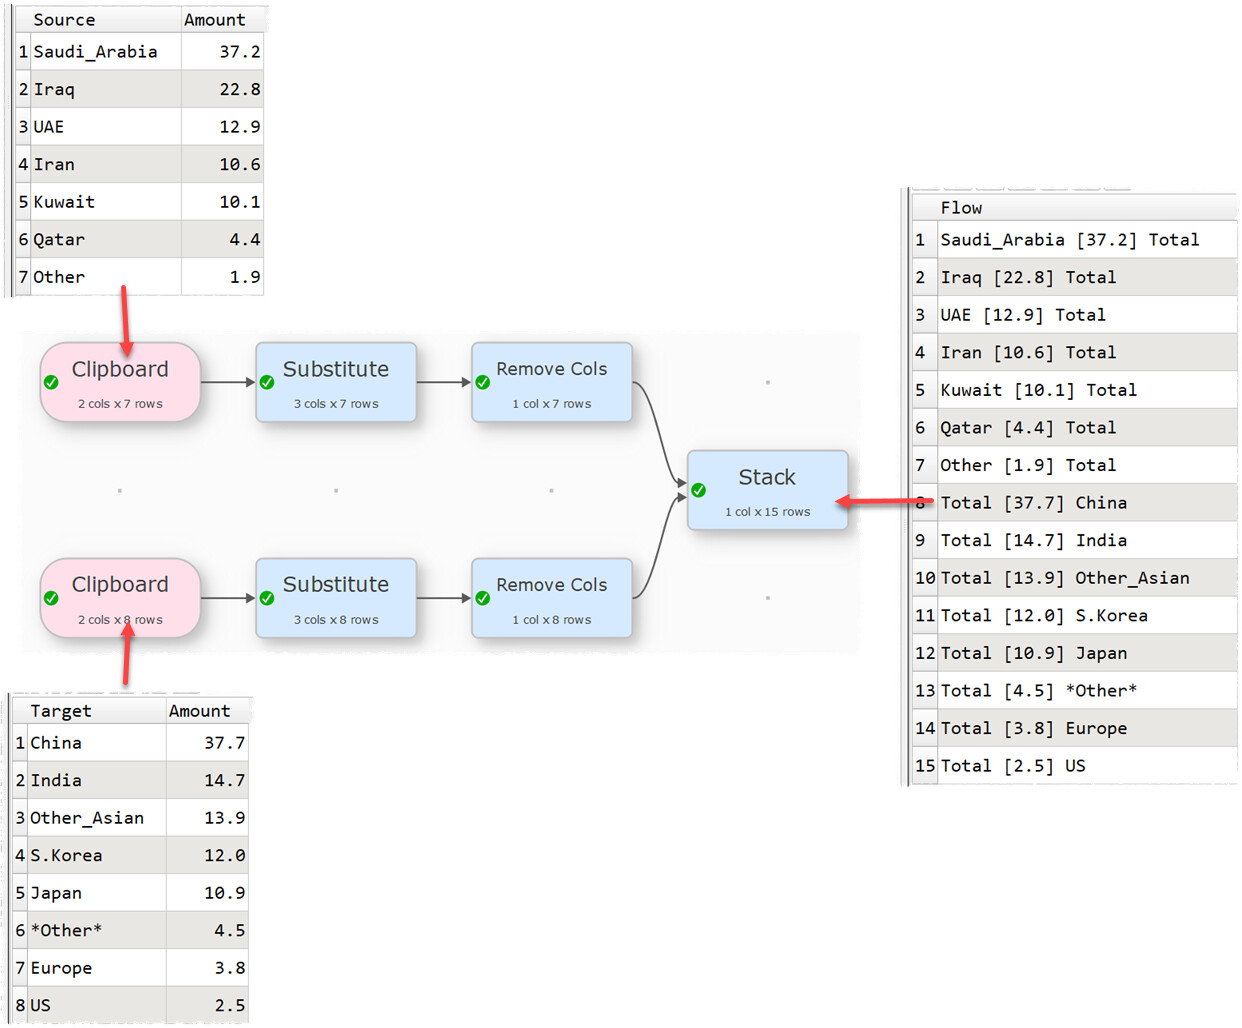
However, you can use Easy Data Transform together with online services such as https://sankeymatic.com to generate a Sankey diagram. Here is a topical example (oil passing through Straits of Hormuz):
sankey.transform (3.9 KB)
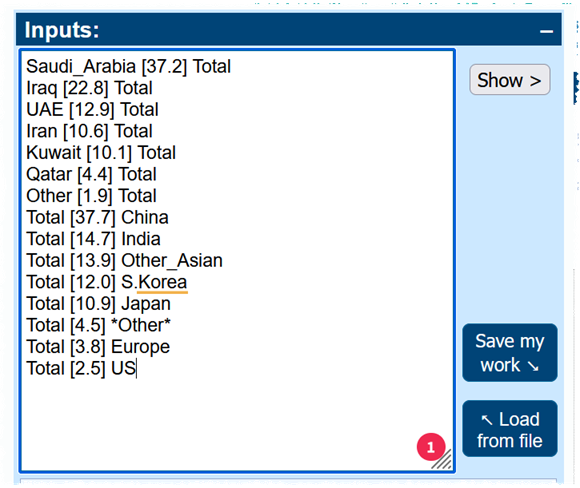
The output can then be copied and pasted straight into SankeyMATIC: Build a Sankey Diagram :
To give: