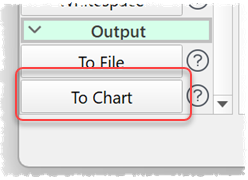
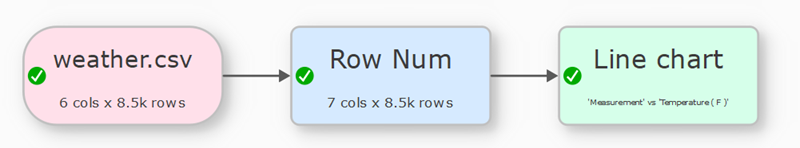
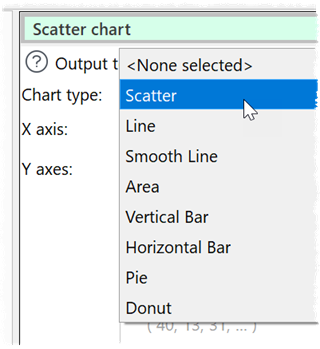
You will be able to add a chart item in the same way you can add an output item. This will allow you to chart a dataset in a few clicks in a variety of chart types:
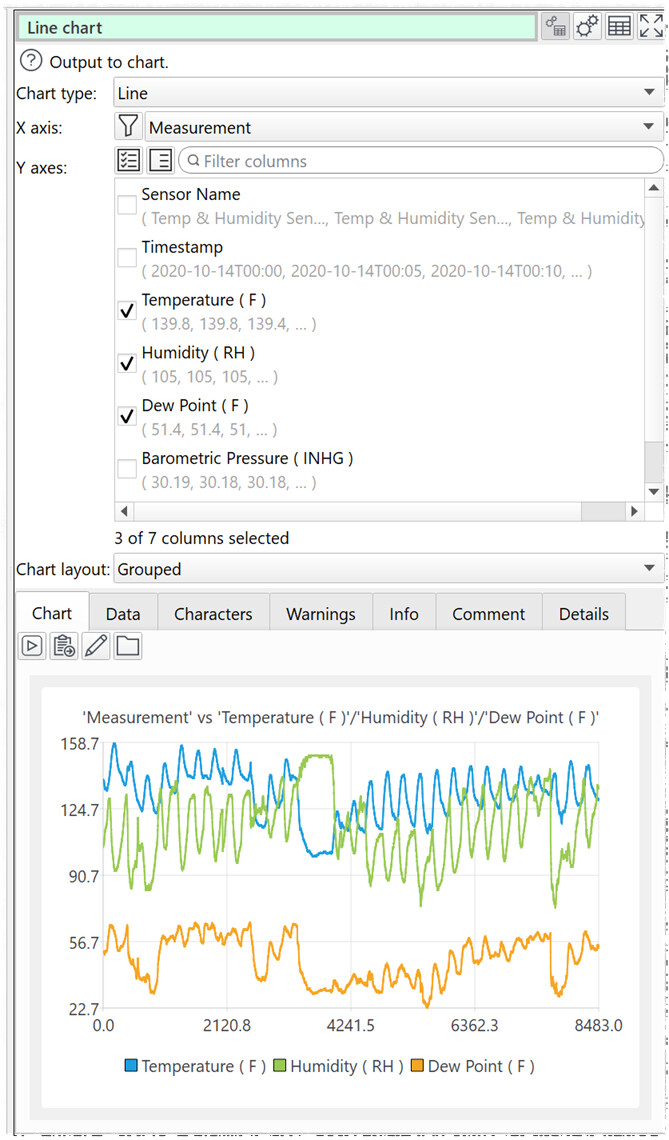
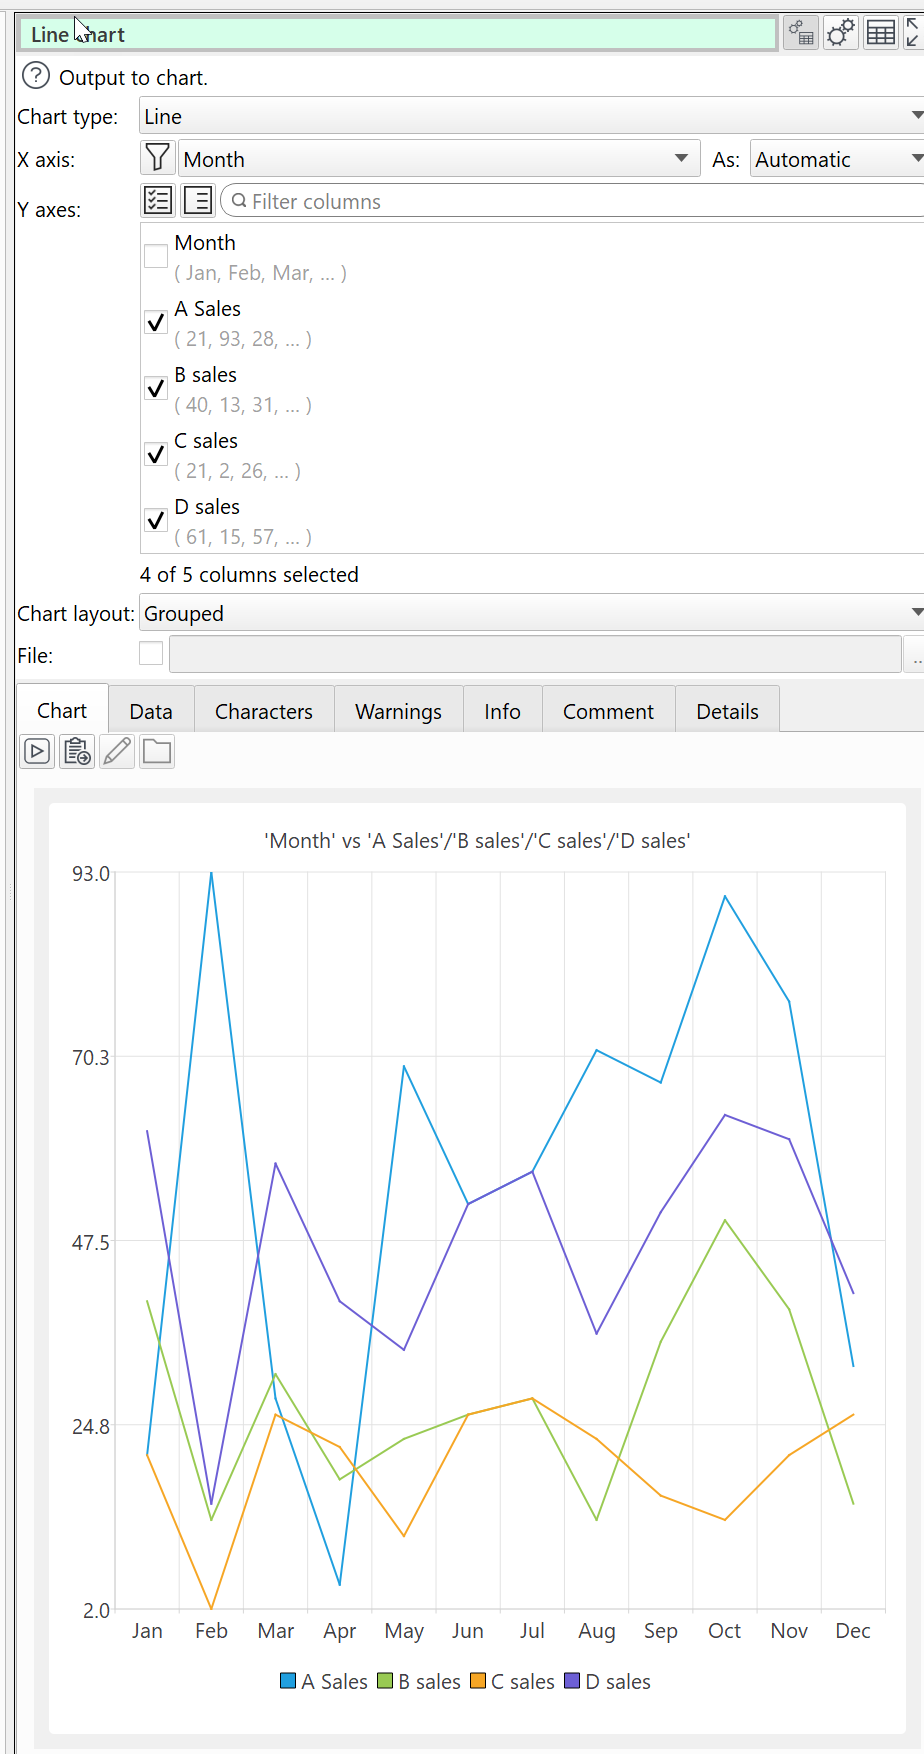
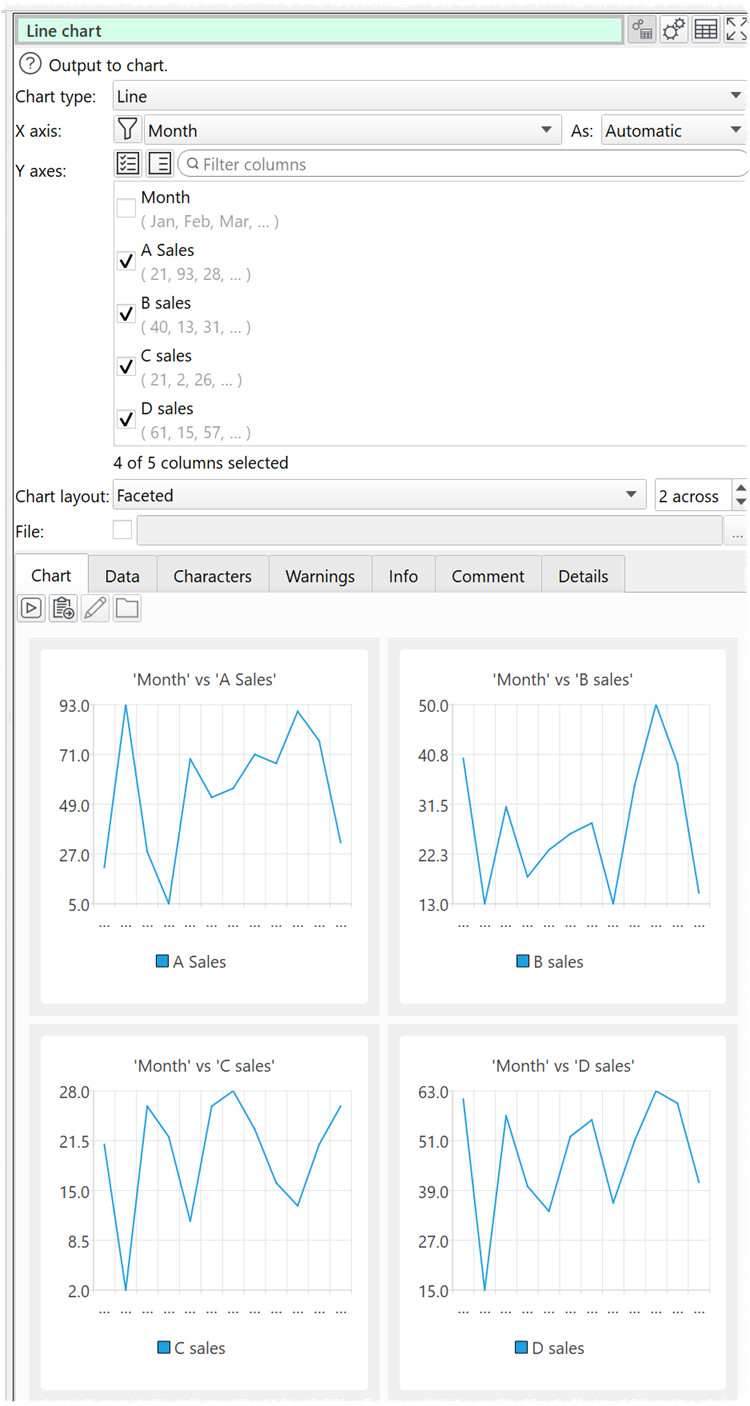
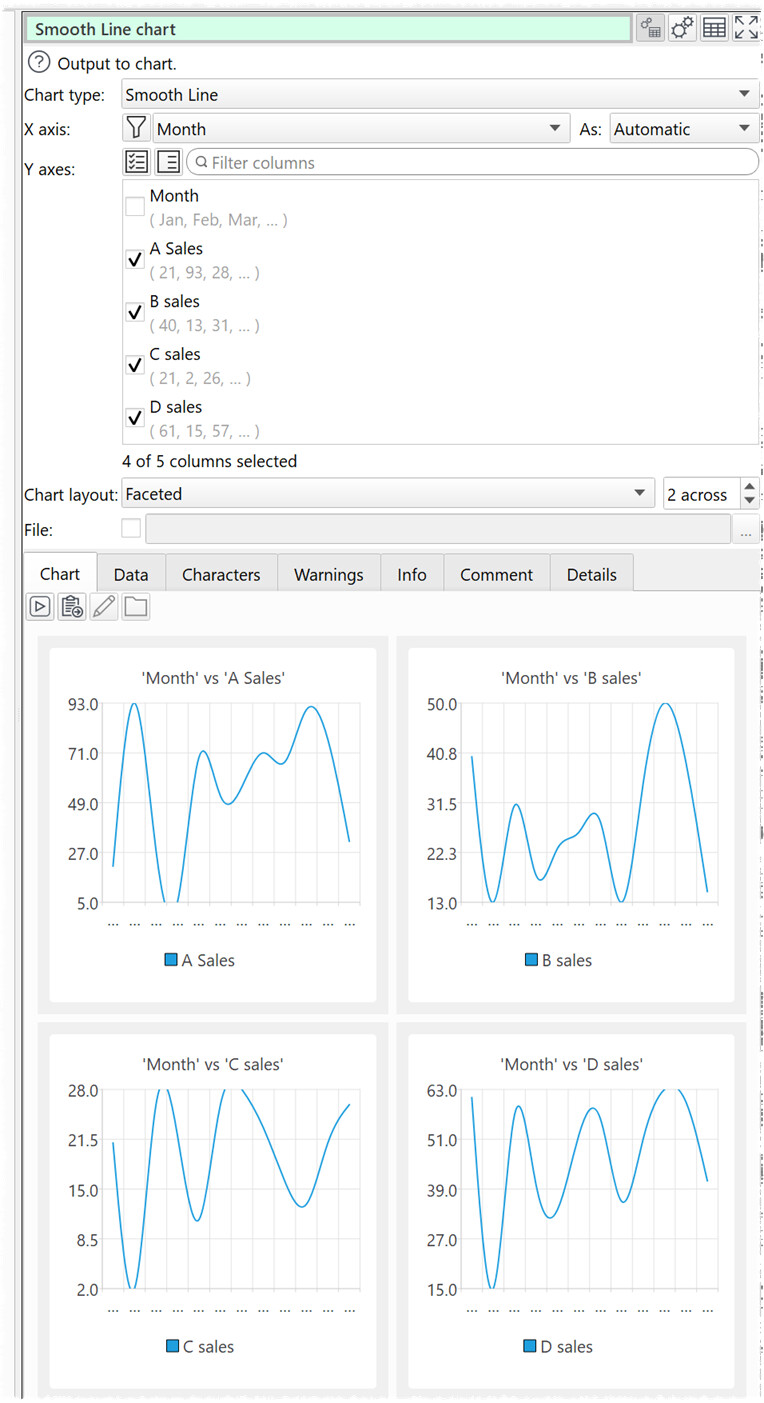
line
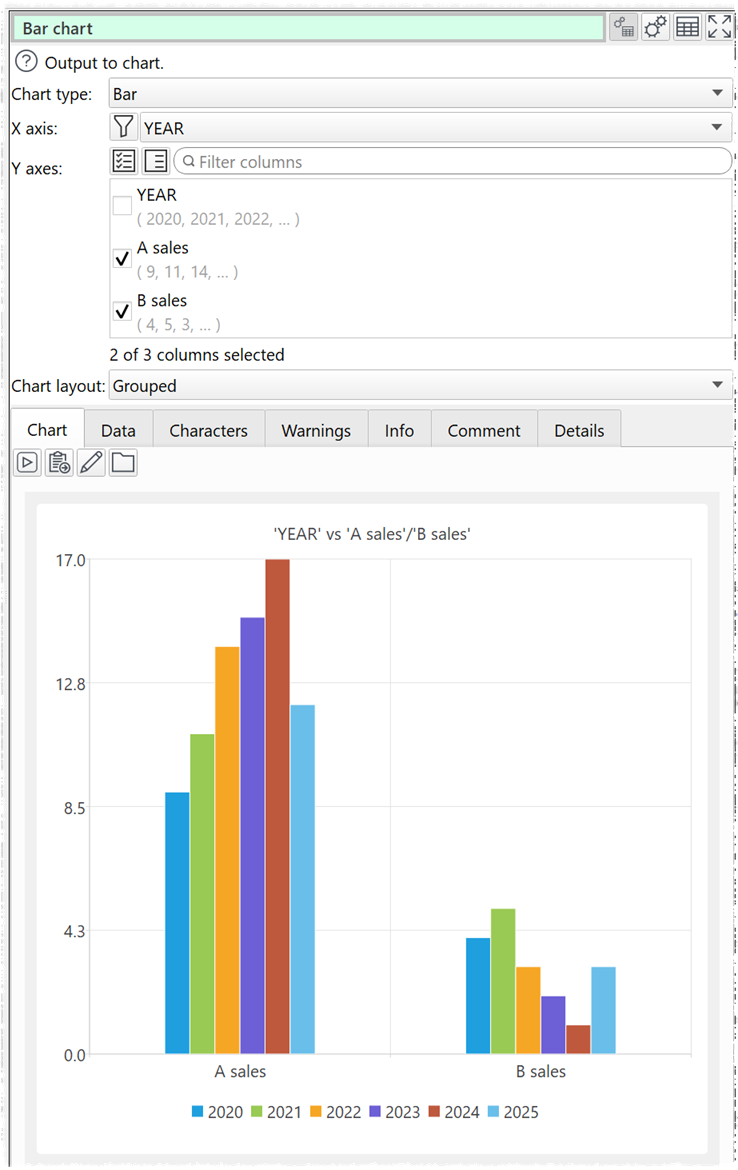
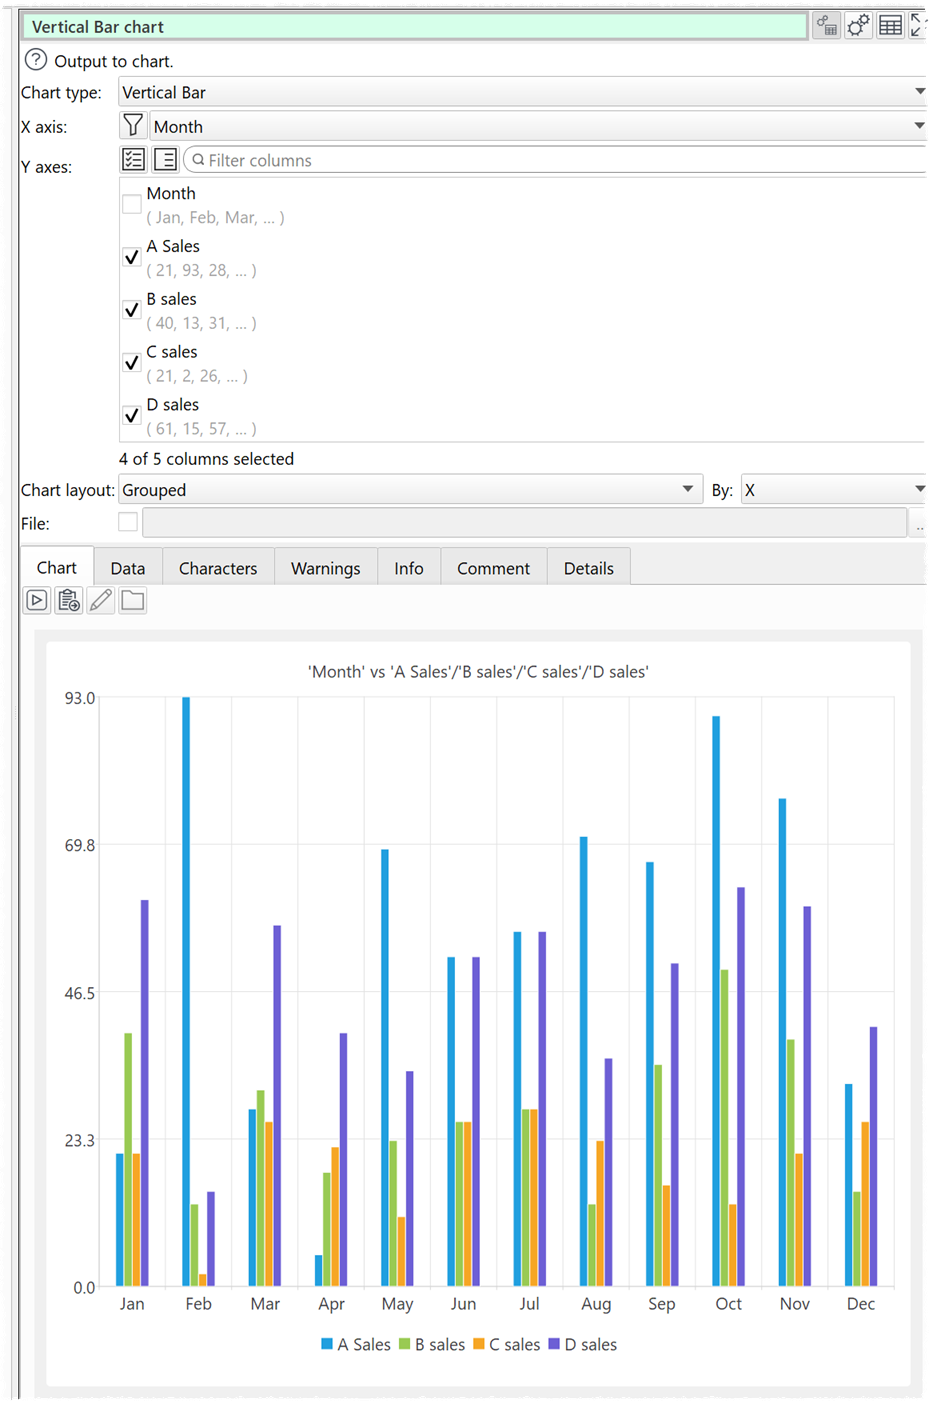
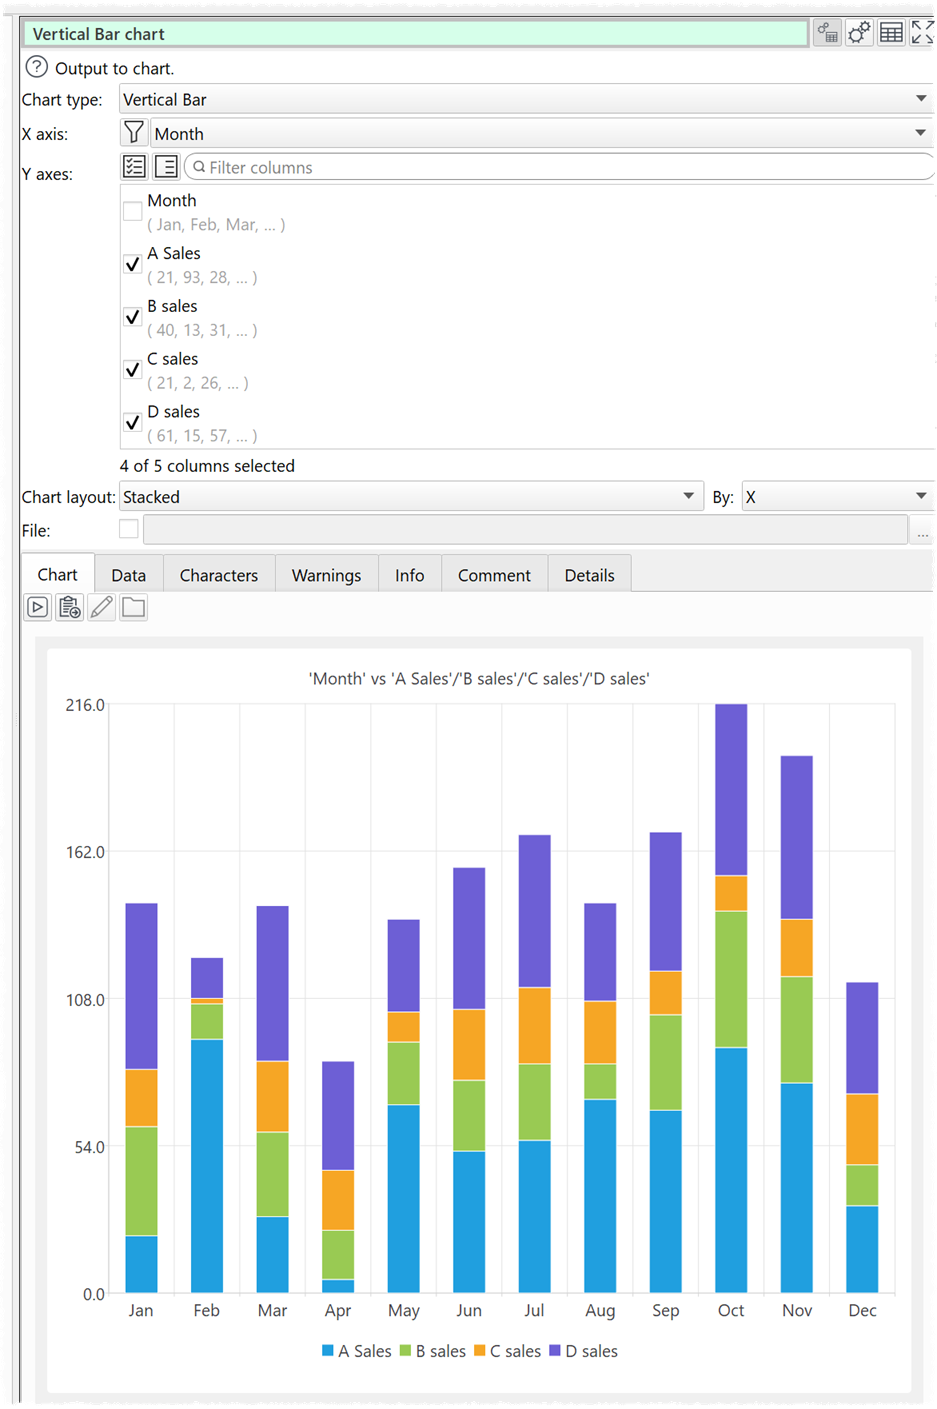
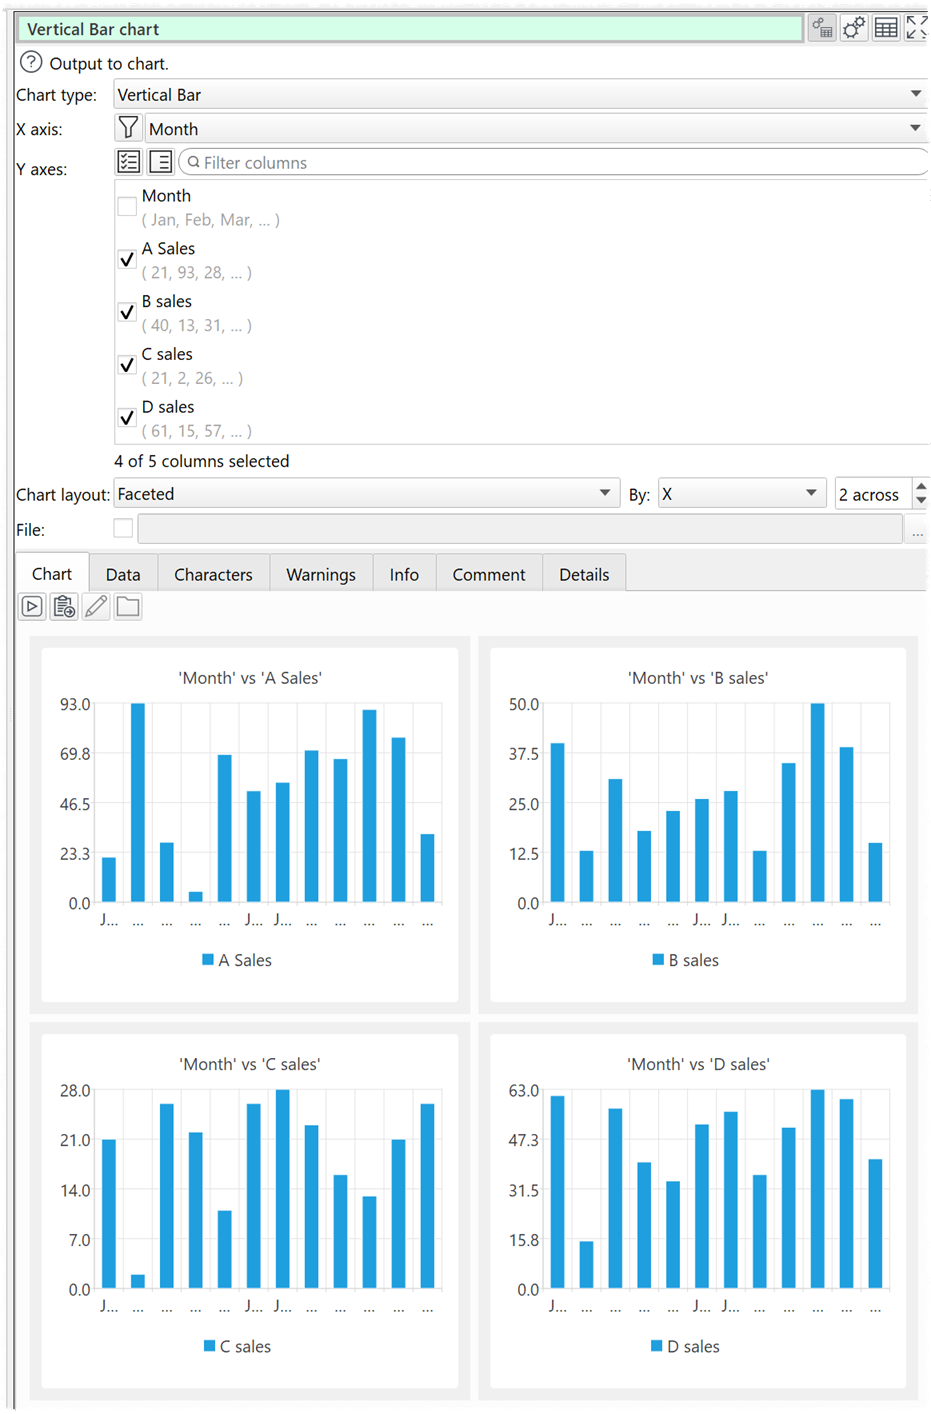
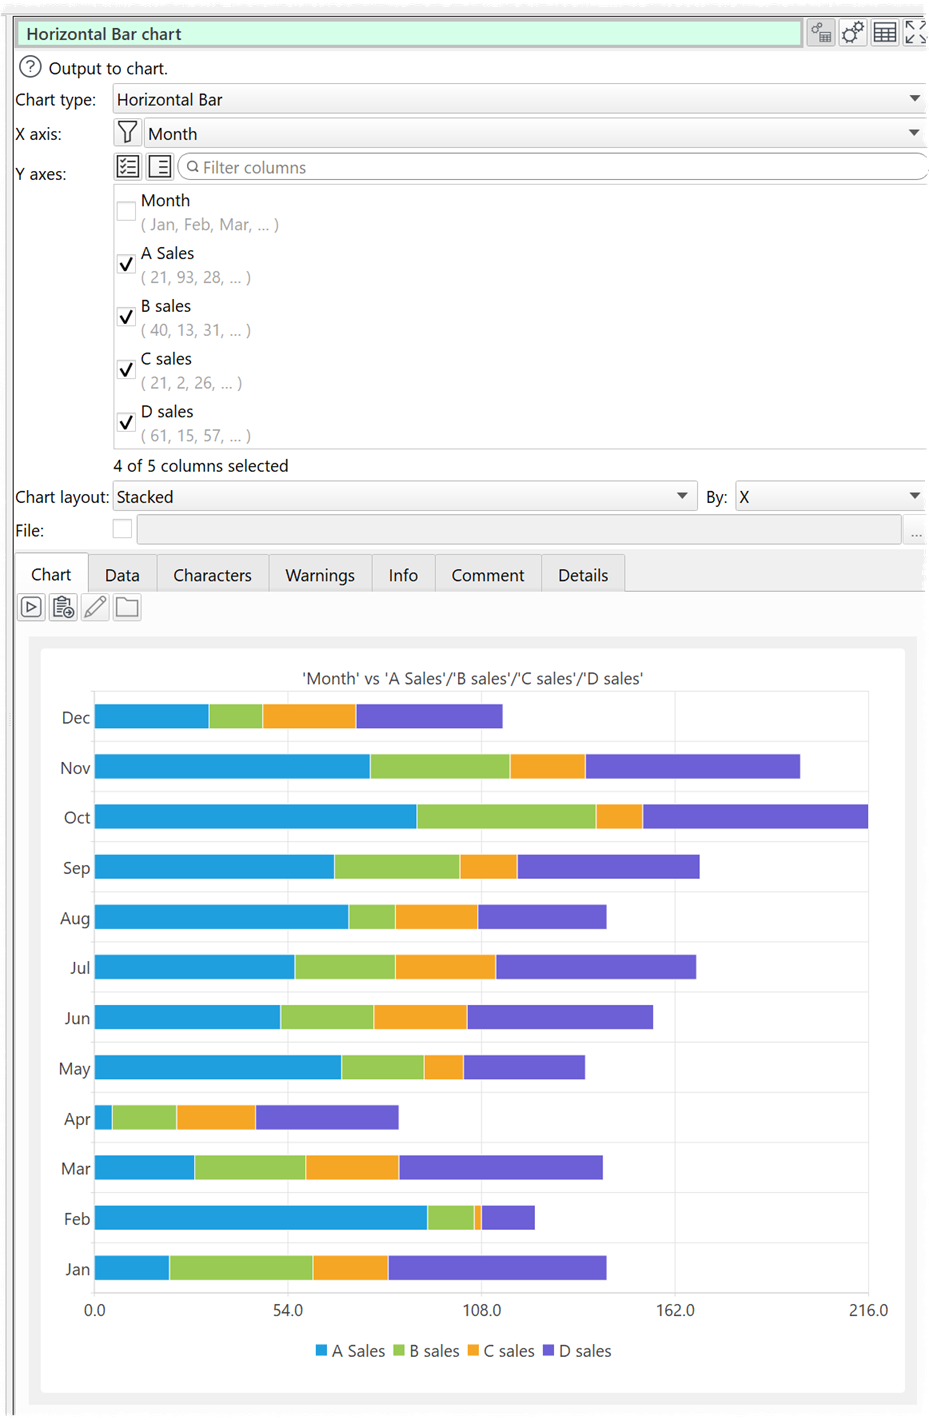
bar
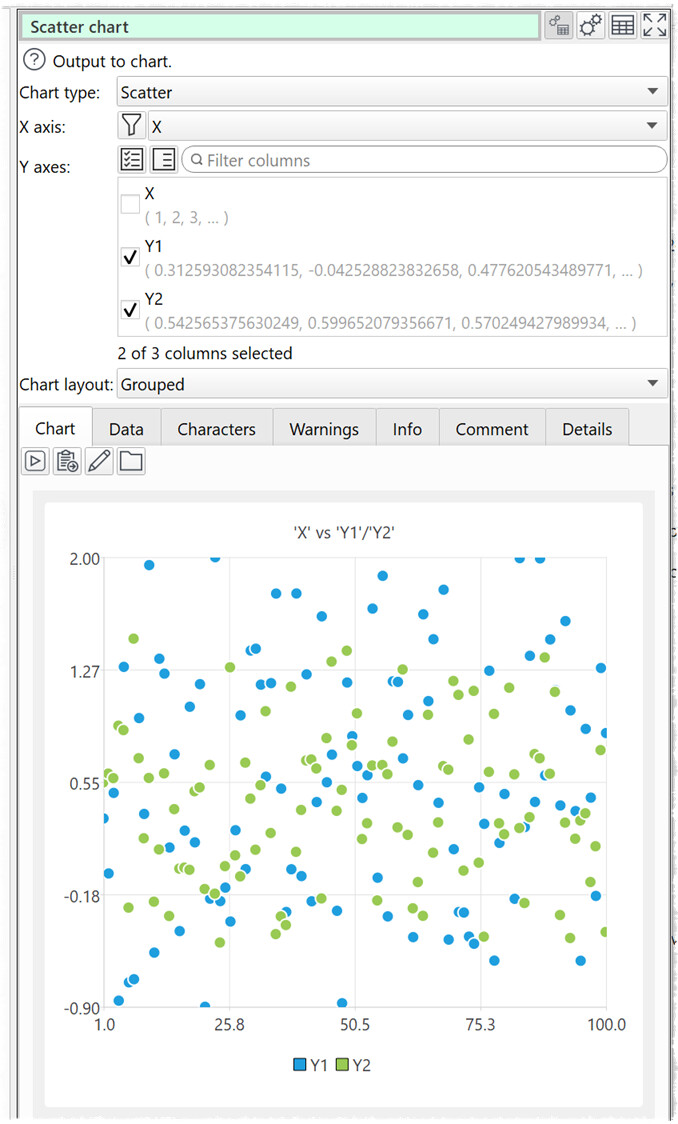
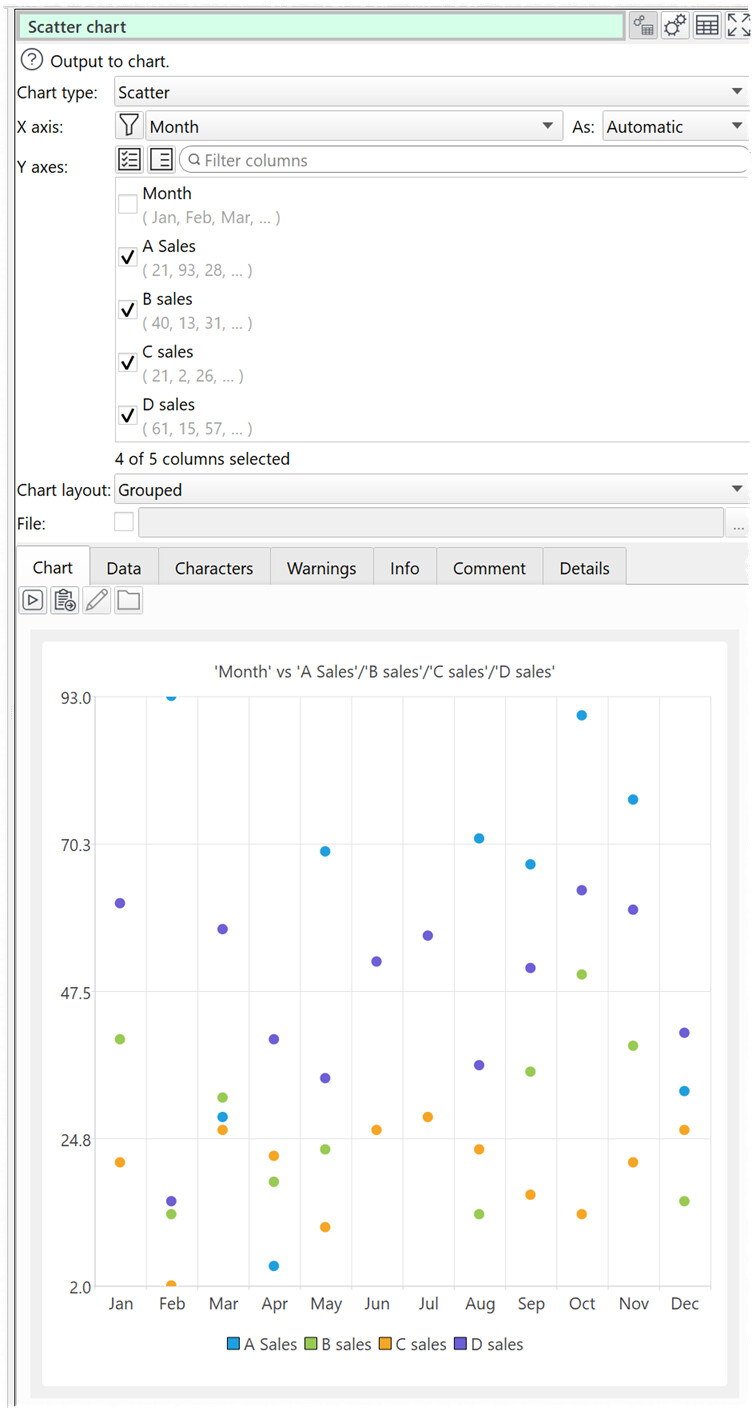
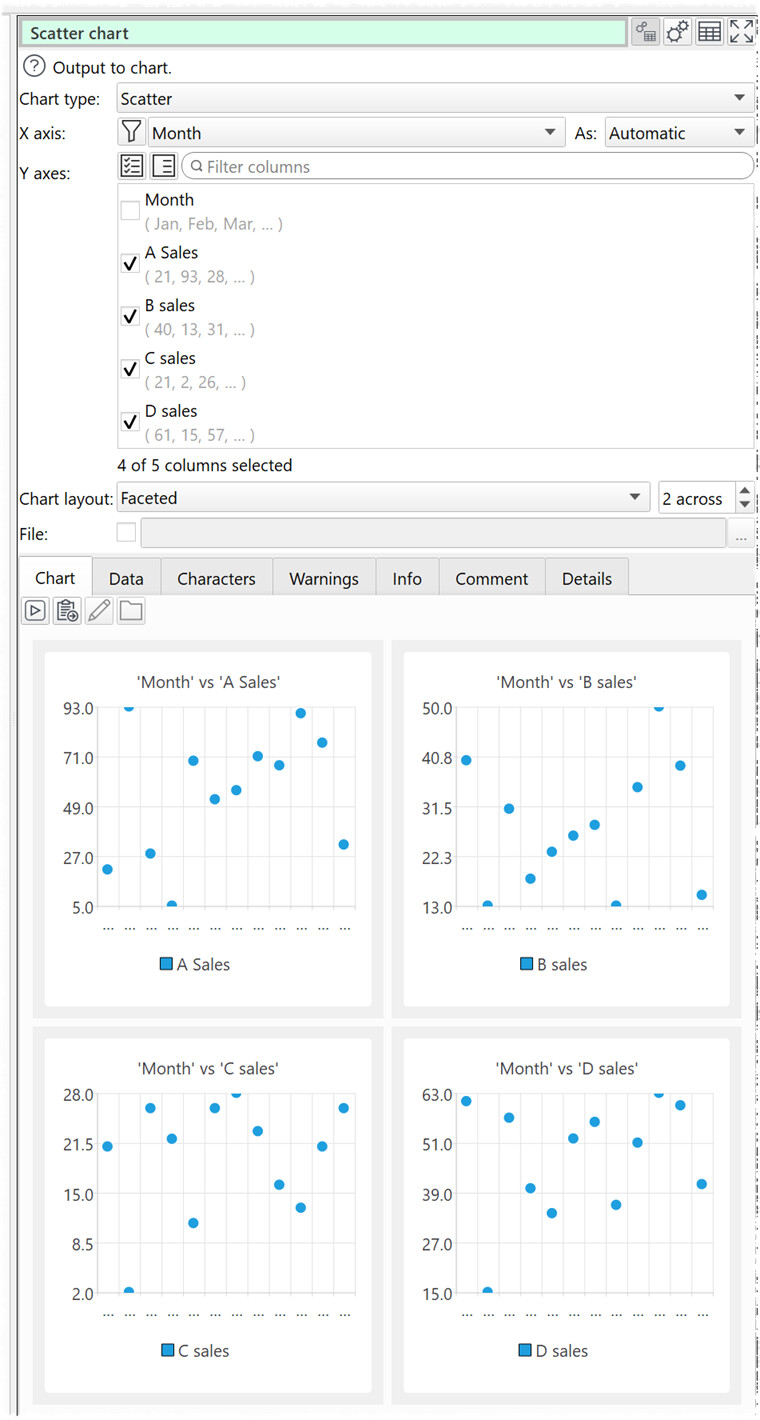
scatter
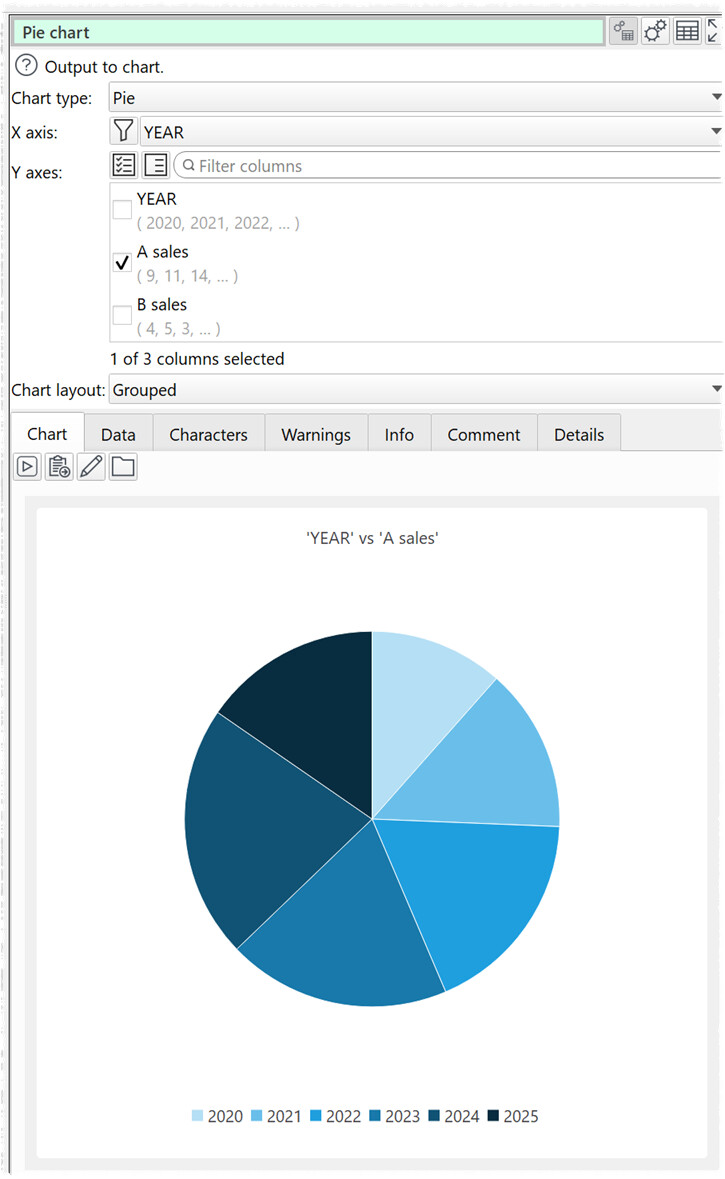
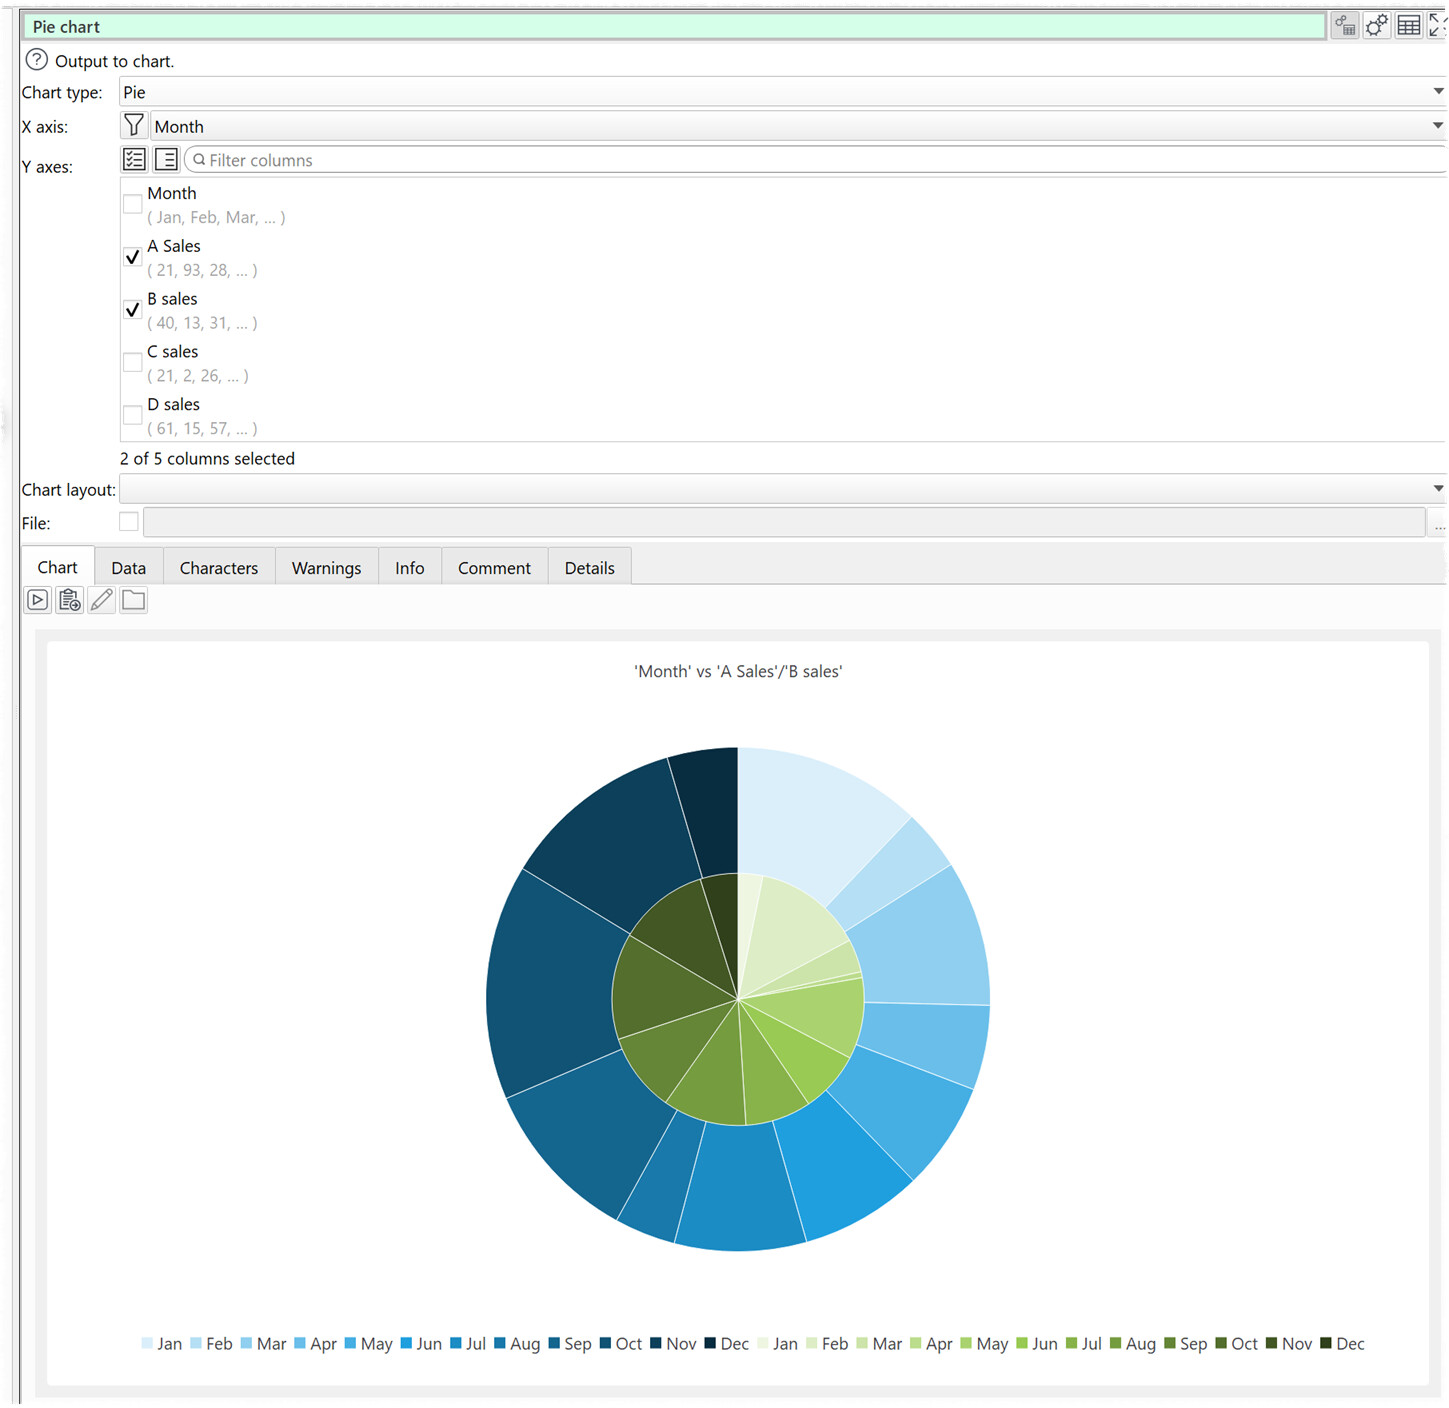
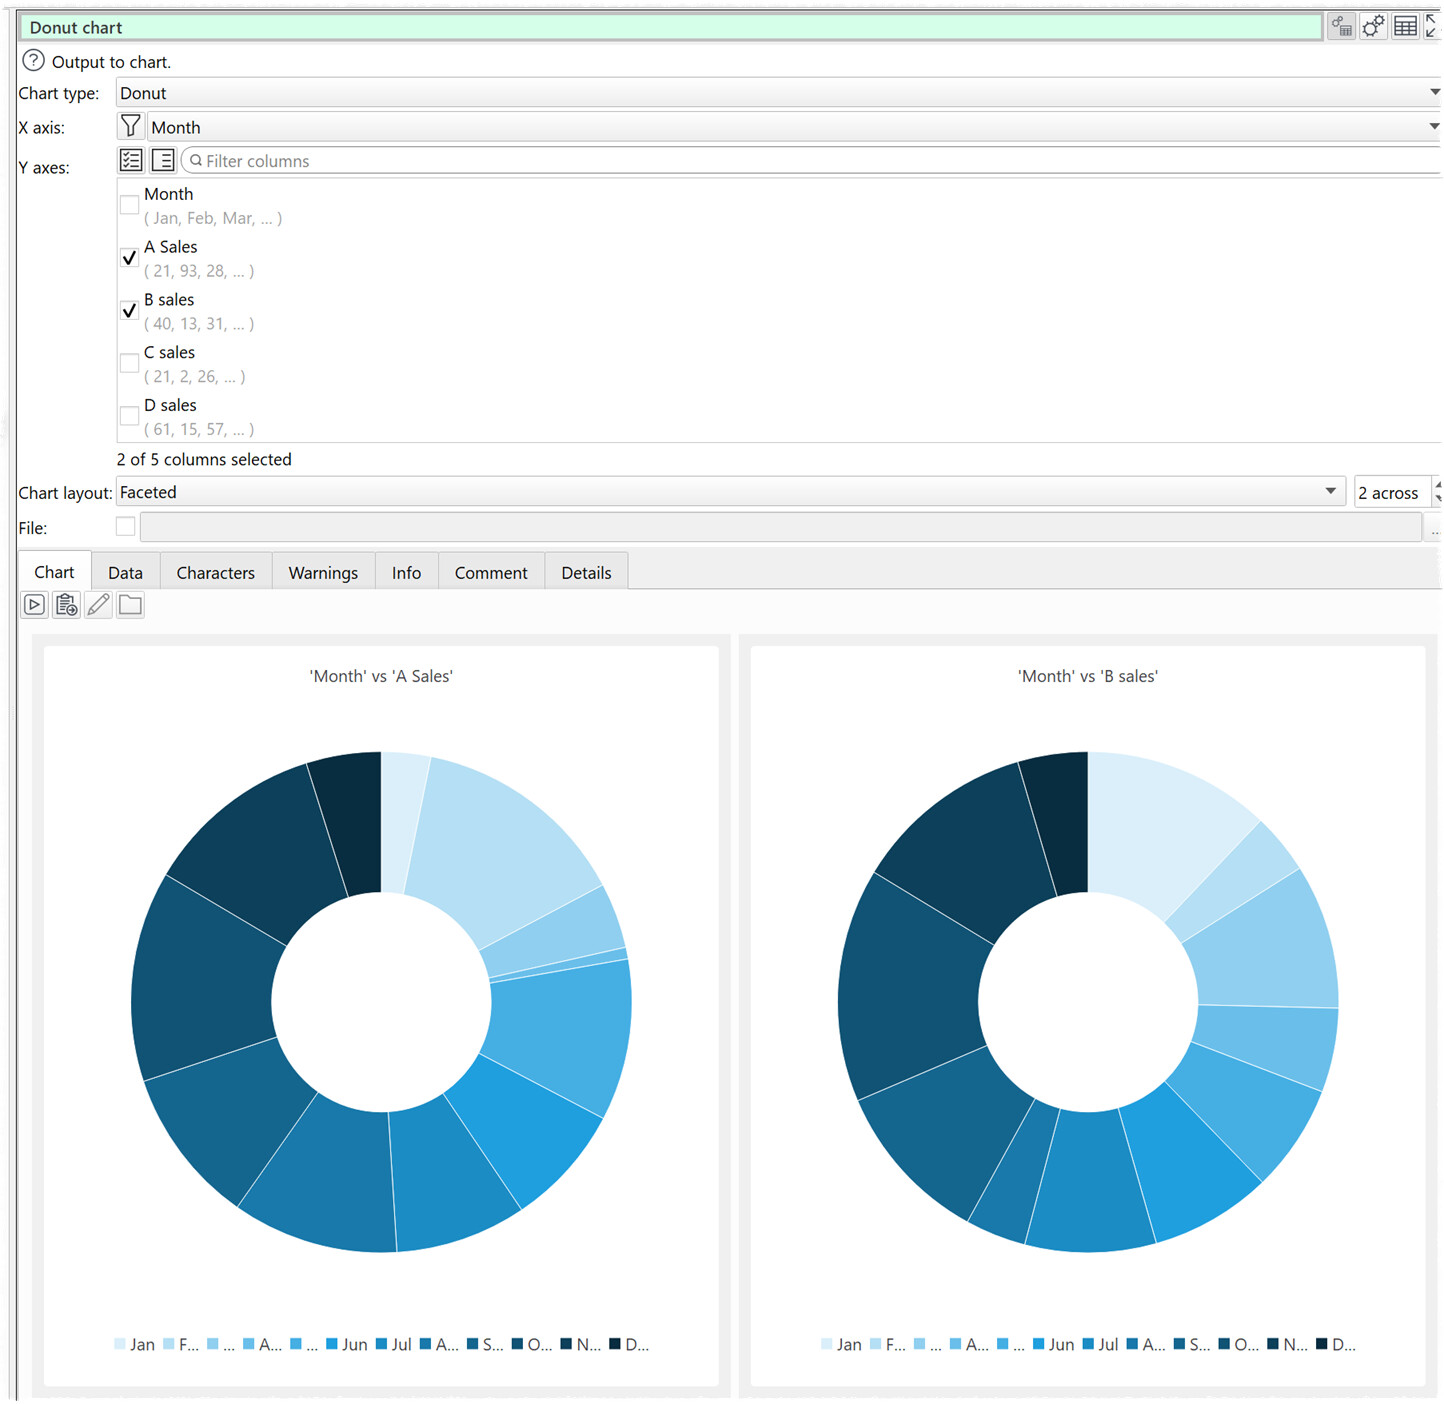
pie
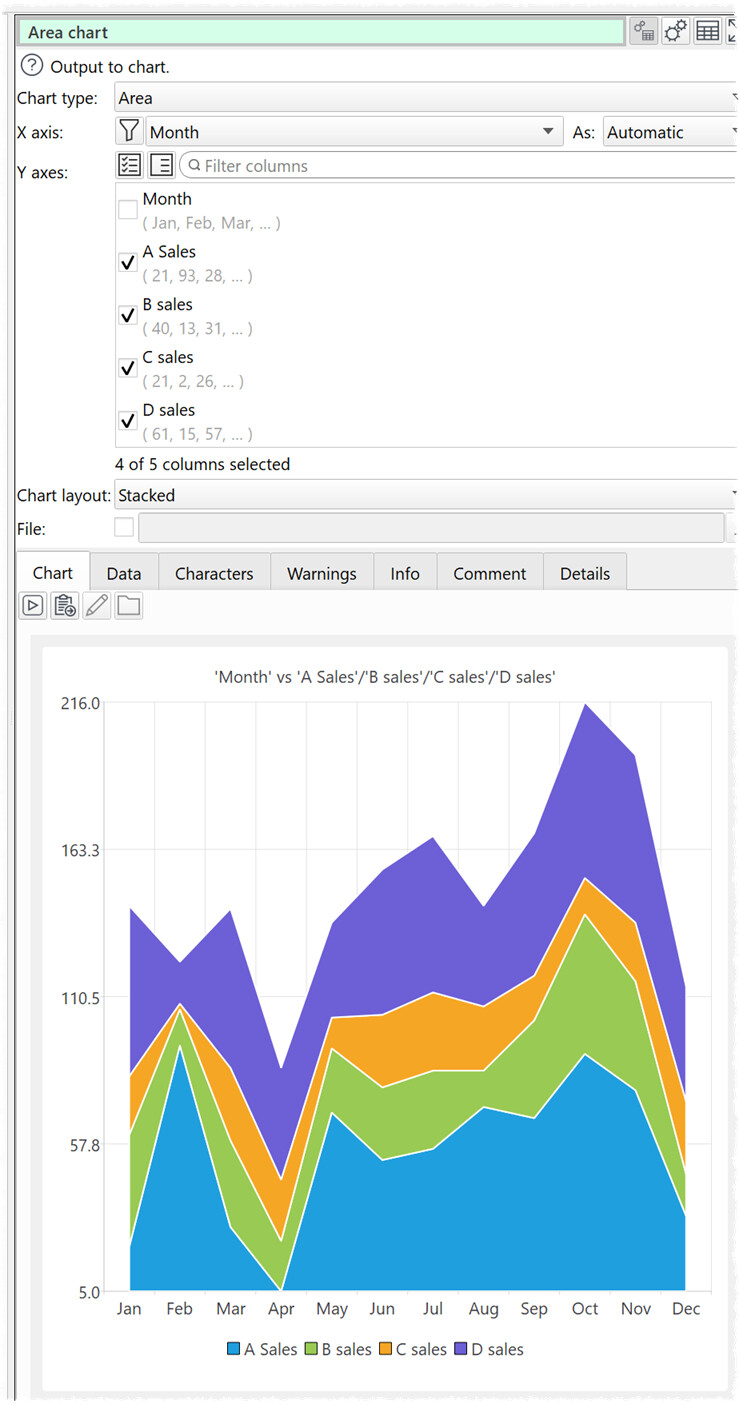
area
We may add other chart types in future. And you will eventually be able to combine multiple charts into a live dashboard.
It will be possible to output all the charts to file. E.g. to PNF/PDF.
Charts will be available as an optional add-on.
Nothing is finalised yet and there is a lot more work to do before we will have anything we can release.
I have a feeling it’s not just going to be useful, it will be a fun sidelight on the world.
Or, maybe I need to get out more. Either way, I keep dreaming of fighting back against bureaucratic machines with charts and graphs triumphing over their most fiendish trickery. You think you can fool me? Here, take this, evil powerpoint nerd!
Quick access to a scatterplot is always handy. My principal purpose for EDT today is to provide input to stats packages or DataGraph and that is unlikely to change.
Realistically we aren’t going to support every obscure chart types and option that dedicated charting software packages supports. But hopefully we can do enough to support the vast majority of use cases without having to use separate charting software, and make it super easy to do so.
Hi there, using EDT for parsing Money Money data (https://moneymoney.app) with a tree of categories, I would love to see Treemaps, I could use to visualize my spendings per category.