Hello,
I have an epidemiological dataset that I would like to prepare for analysis.
Currently the data has a group identifier in the first column (CL/P vs CP) and data is contained in the following columns.
Below a short example:
| Type | BW | F age birth | M age birth | F age conc | M age conc |
|---|---|---|---|---|---|
| CL/P | 3060.00 | 24.41 | 23.33 | 23.74 | 22.58 |
| CP | 3080.00 | 30.91 | 30.41 | 30.16 | 29.58 |
| CP | 3820.00 | 34.41 | 34.66 | 33.66 | 33.91 |
| CP | 3620.00 | 43.91 | 28.83 | 43.83 | 28.83 |
| CL/P | 3260.00 | 35.41 | 34.16 | 34.66 | 33.41 |
| CP | 2280.00 | 36.83 | 35.33 | 36.16 | 34.58 |
| CL/P | 4070.00 | 43.33 | 34.33 | 42.58 | 33.58 |
| CP | 3200.00 | 34.49 | 31.83 | 33.74 | 30.41 |
To be processed in my statistical package that unfortunately does not support grouping like SPSS, I need to have the data as follows (different data from above):
| CLP BW | CLP F age birth | CLP M age birth | CLP F age conc | CLP M age conc | CP BW | CP F age birth | CP M age birth | CP F age conc | CP M age conc |
|---|---|---|---|---|---|---|---|---|---|
| 2530 | 31.91 | 29.99 | 31.24 | 29.33 | 3080 | 30.91 | 30.41 | 30.16 | 29.58 |
| 3060 | 24.41 | 23.33 | 23.74 | 22.58 | 3820 | 34.41 | 34.66 | 33.66 | 33.91 |
| 3260 | 35.41 | 34.16 | 34.66 | 33.41 | 3620 | 43.91 | 28.83 | 43.83 | 28.83 |
| 4070 | 43.33 | 34.33 | 42.58 | 33.58 | 2280 | 36.83 | 35.33 | 36.16 | 34.58 |
| 3535 | 36.41 | 34.16 | 35.66 | 33.41 | 3200 | 34.49 | 31.83 | 33.74 | 30.41 |
| 3750 | 33.16 | 35.83 | 32.41 | 34.99 | 2875 | 39.91 | 34.58 | 39.24 | 33.83 |
| 3570 | 34.66 | 28.41 | 33.91 | 27.66 | 3180 | 40.91 | 35.83 | 40.16 | 34.41 |
The columns will have a different number of rows depending on missing values and differences in frequencies in the groups.
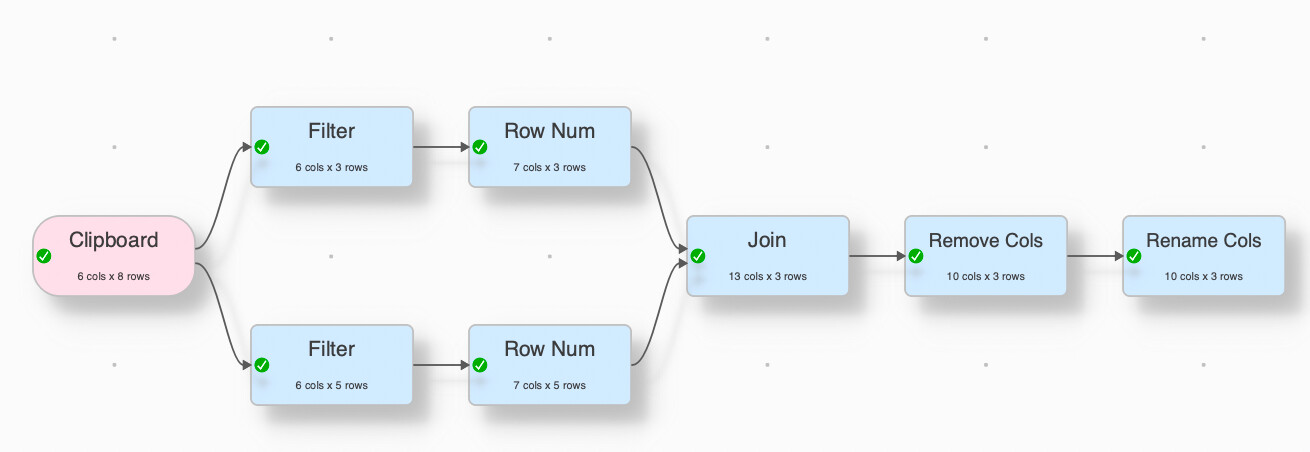
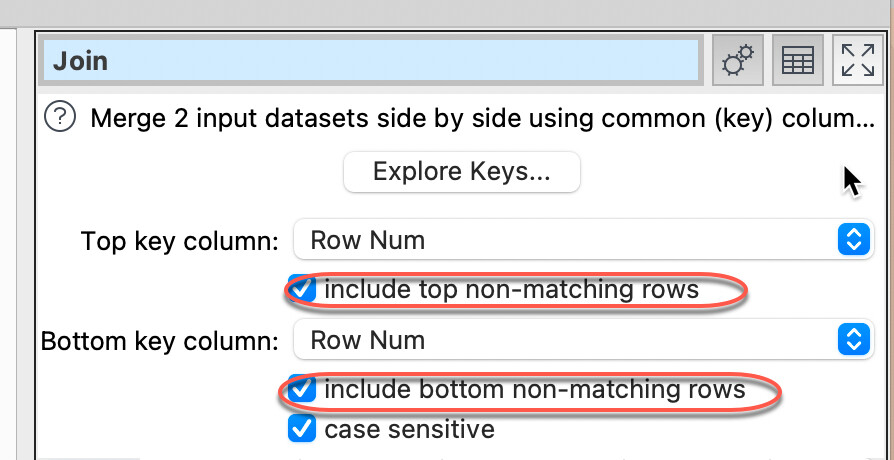
I can filter and segregate the CL/P from the CP, but how can I then bring together the filtered columns from two different branches to create a new table? With a pivot I get to the result for a single variable but I have empty cells that I cannot simply delete shifting up the cells below (wish for a future release…)
Currently I filter for CL/P and export the data and redo for CP.
Is there a smarter way?
Thank you in advance,
GLS