That’s wild. I suppose the log base in his example would be the number of possibilities plus one? Did he use 10 because there were nine first digit possibilities?
Would the same formula show the same results for populations in hexadecimal, using log base 16?
Apparently you can use any integer base >= 2 and P(d) = logb(1+1/d) still applies. But log 2 isn’t very useful because 100% of base 2 numbers begin with 1. Log 10 is used because it is what people are mostly comfortable with.
I believe the formula would still apply in base 16, but the distribution would be different.
Think of Benford’s law as acceleration. You have to double in value to go from 1 to 2 but only increase by a ninth to go from 9 to ten. As the value goes up, the percentage increase between leading digits goes down until you carry to a new digits place.
That’s a logarithmic progression of leading digits as an artifact of writing numbers in powers.
Here’s an exercise for me. As a hypothesis, I think the same distribution will apply to any digit except the units place with one condition.
I think the third digit (the hundreds place), for example, would follow that distribution for all members of a representative set greater than 100.
Right now that’s just a wild guess. I think it’s probably true.
Just as long as the numeric notation is in evenly increasing powers. Roman numerals aren’t fair. Repeating and missing values would skew the distribution, too.
I think. I must ponder. As a certified math dummy, things like this fascinate me.
From the 4th digit the distribution is essentially random, as are mantissae in Newcomb’s original formulation. If you were trying to analyse numbers using Newcomb-Benford, check median absolute deviation from expectation in the first digit and ranking of the second; that will be close enough for most purposes.
I don’t have the math background to tell, but it seems if you took all the integers the distribution would be perfect according to the log for the first digit. The second digit would be the same set of numbers, repeated ten times.
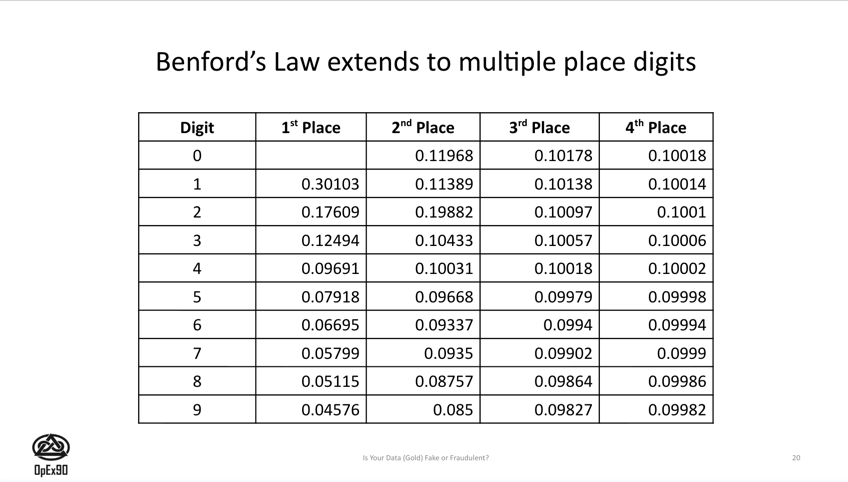
The digit distribution will be ~10% chance of each digit by the time you get to the third or fourth digit, as shown in the article @Monotone94 linked to.
Note that Benford’s (Newcomb’s) law only applies if:
values are random
values span at least 2 orders of magnitude
So it won’t apply to adult height data, as the values won’t span a big enough range.
I’m late to the dance on this topic. Every semester at I teach about Benford’s law at the Thayer School of Engineering at Dartmouth. Below is a little cheat sheet for you on the leading digits probability by place.