Monthly and Daily Average Calculation for Sensor Data (Solved)

Hi EDT, Question, extending from the example workflow using values for multiple hours presented for a single day as a row where a daily average could be calculated by calculating between column values:

Is there an easy way to calculate the daily average (and potentially using a similar workflow find the other basic descriptive statistics if possible with the same workflow) for a single day from datetime sensor data similar to that shown below? In this case there is not a set of entries for a single day but a time series.

Here is an example dataset showing 30 minute even-timed example sensor data (random sensor data values):


Here is the data embedded in a otherwise blank .TRANSFORM file to act as an upload container to the forum: sampleData.transform (8.2 KB)
What I am looking to do is output general descriptive statistics (avg., count,. sum, max, min, median, mode, stdev., etc.) for each day, with the average being the most important of all of these figures. Also, I don’t see median and mode as options in Pivot, are these available via another approach?

Yes. You can use Extract to keep only the date part of ‘Sensor DateTime’, then a Pivot average.

daily-average-from-timestap.transform (9.5 KB)

If you wanted to find, say, the S.D as well you can do it like this:

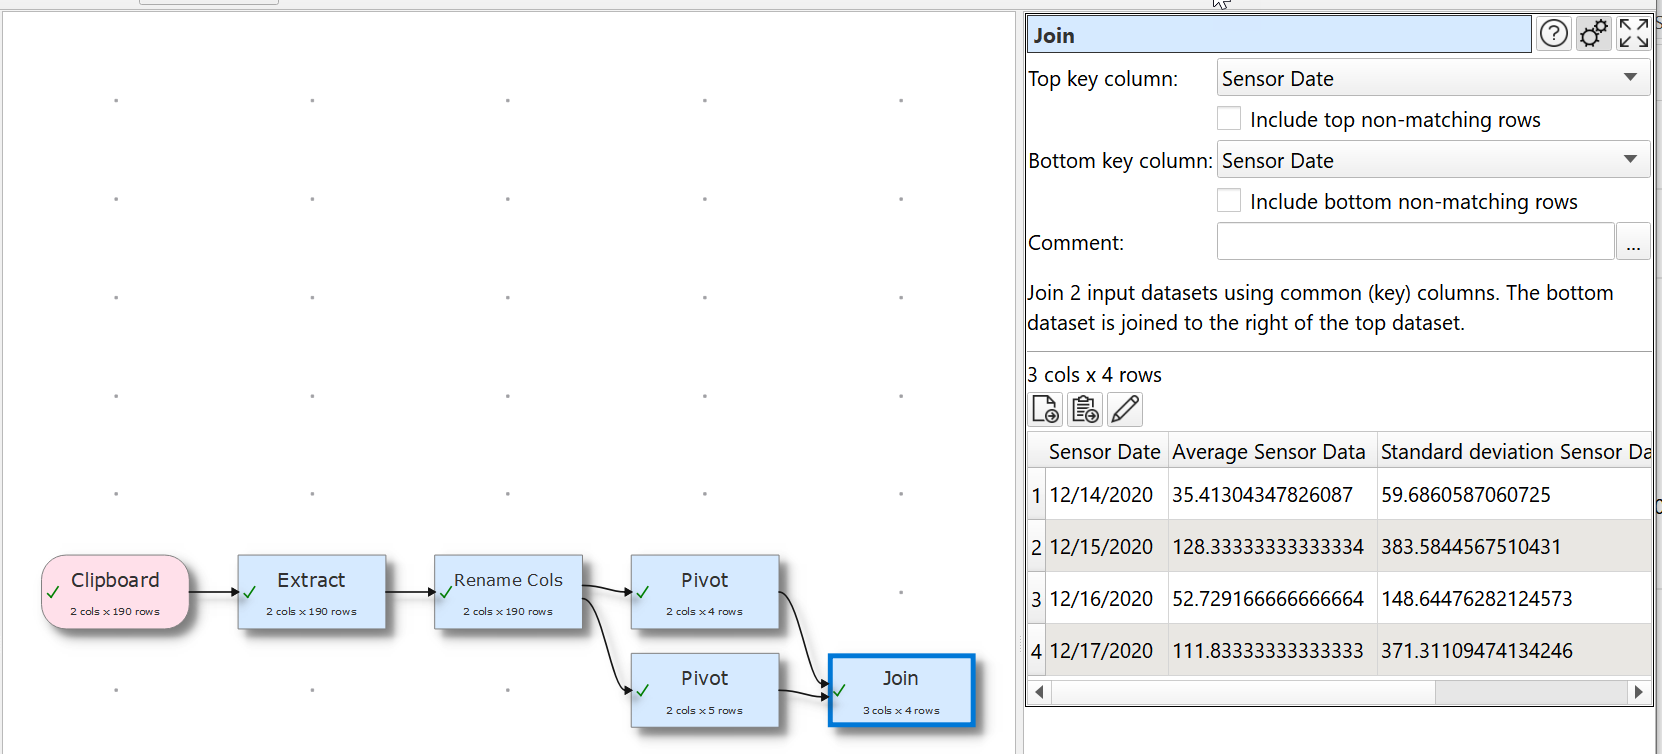
daily-average-from-timestamp2.transform (10.6 KB)

1 Like

Do you commonly need to use median in pivots?

Mode is a bit tricky when you have real (non-integer) numbers.

In the next release Summary has median and S.D. plus the existing ‘most frequent’ (string based). So you could use Filter to get 1 day and then use Summary.

1 Like

Median is often used as a litmus test to see how far the average is away from the middle to quick test for skew. Returning Mode and min/max are quick checks for outliers, error repeats, zeros, etc. Your solution to mode sounds perfect for the upcoming release returned as a string that could be conditionally replaced if needed.

If potentially on your development path, and easy, would you also consider adding Median to the pivot operation in an upcoming version?

Thank you again, the average and STDEV are the most important operations and your workflow takes care of this need perfectly!

This is perfect, thank you! So the 10 length option allows you to select by comparing just the “date” part of the datetime, evaluated as a string, correct?

If I reformatted using the Date Format function, I could use this same method just looking at year and month alone to calculate monthly averages, correct? Is there something missing in my date formatting as presented that is preventing me from restructuring the date format to do this operation?


daily-average-from-timestap_MOD.transform (9.9 KB)

I will add it to the wishlist.

The most frequent text is already available in summary.

1 Like

Correct. It just truncates the time part.

You need to remove the time part first.

1 Like

Ahh, makes sense, thank you, @Admin !

(solution posted)


monthly-average-from-timestap.transform (11.3 KB)

1 Like

Quick follow-up question: if you are using a datetime from EXCEL formatted in m/d/yyyy, to extract the datetime in one swoop appears problematic as the length changes to do daily averages. To fix the date this requires the DateFormat, which requires one to already strip off time. The workaround I was using was reformatting in Excel (see below) before using EDT, but is there a means to reformat in mm/dd/yyyy to allow daily averages via this method w/o first reformatting in Excel?


image

You can use the Extract Transform to return the date data and not the time data.

Hi Dan, but if the length changes because the format is M/d/yyyy (see Timestamp column in my posted example of Extract’s output), is there a way to cause extract to shift along with the field length change w/o splitting the data. Right now I added an Excel step to reformat the date - just looking for a way to do it all in EDT.

Use the Date Transform MM/dd/yyyy to standardize the date. You will always get 10 characters.

1 Like

Hi Dan, Please show me what you mean. I thought you had to extract the time to use Date Format (per Monthly and Daily Average Calculation for Sensor Data (Solved)), but without a consistent date length, Extract doesn’t work consistently, so you get a sort of chicken and egg problem between Extract and Date Format to get a consistent date format that can be used to perform averaging by days (ultimately) with pivot:


dateformatexample.transform (2.9 KB)

@DanFeliciano is correct. Reformatting from M/d/yyyy to MM/dd/yyyy will change it from a variable date length (8 to 10 chars) to a fixed date length (10 chars).

@DanFeliciano and @Admin, just to clarify, I have to strip off time to get the Date Format to work, right? But if the date is shifting in character length, how can Extract work properly to do this to prep it for Date Format?

@Admin, please see attached where I am trying to reproduce your example - what am i doing wrong?


dateformatexample.transform (3.8 KB)

You need to strip off the time part of the ‘Timestamp’ column. You can always use Split Col to split at the space, do the Date Format and then use Concat Cols to add the time information back again.

Works perfectly, thank you @Admin and @DanFeliciano

@Admin, quick question. I am looking to recombine averages calculated using the date as the key as in your example: Monthly and Daily Average Calculation for Sensor Data (Solved)), this works perfectly with Join for 2 inputs, but if I am creating a summary where I calculate the average of multiple columns do I need to use tiers of Joins or is there a way to do this using the common key column name for all columns, or just non-key horizontally stack the columns then remove the redundant date columns? Also, In all of this I am assuming there is no way to do a “multi-pivot” where each selected column’s Values are discretely pivoted in different columns, right? The overall goal is to calculate the monthly average for multiple columns of data.

image

To join 3 datasets you will need to use 2 joins, here is an example of joining 6 datasets:

You could do that using Stack followed by Unique with Keep uinique on the date column and Concat on the values. But all the data values would end up concatenated in a single column, which is probably not ideal.

Currently, no.

1 Like

Much appreciated, accomplished with tiers of Joins

1 Like